


FXOpen
Yesterday, the price of the S&P 500 stock index rose to record closing highs on Thursday. Moreover, such a growth rate (+2.11% per day) has not been observed for 13 months.
Reasons for Extremely Bullish Sentiment:
→ Nvidia's report, which showed impressive earnings and prospects (the company forecasts roughly threefold revenue growth in the first quarter of 2024 amid strong demand for its AI chips). Nvidia's capitalization grew by USD 277 billion in one day — a historical record for the US stock market.
→ Positive news background for yesterday: the US Flash Manufacturing PMI index was actually = 51.5, expected = 50.5, a month ago = 50.7. Signals from the labor market were also positive - the weekly number of applications for unemployment benefits turned out to be = 201k (expected = 217k).
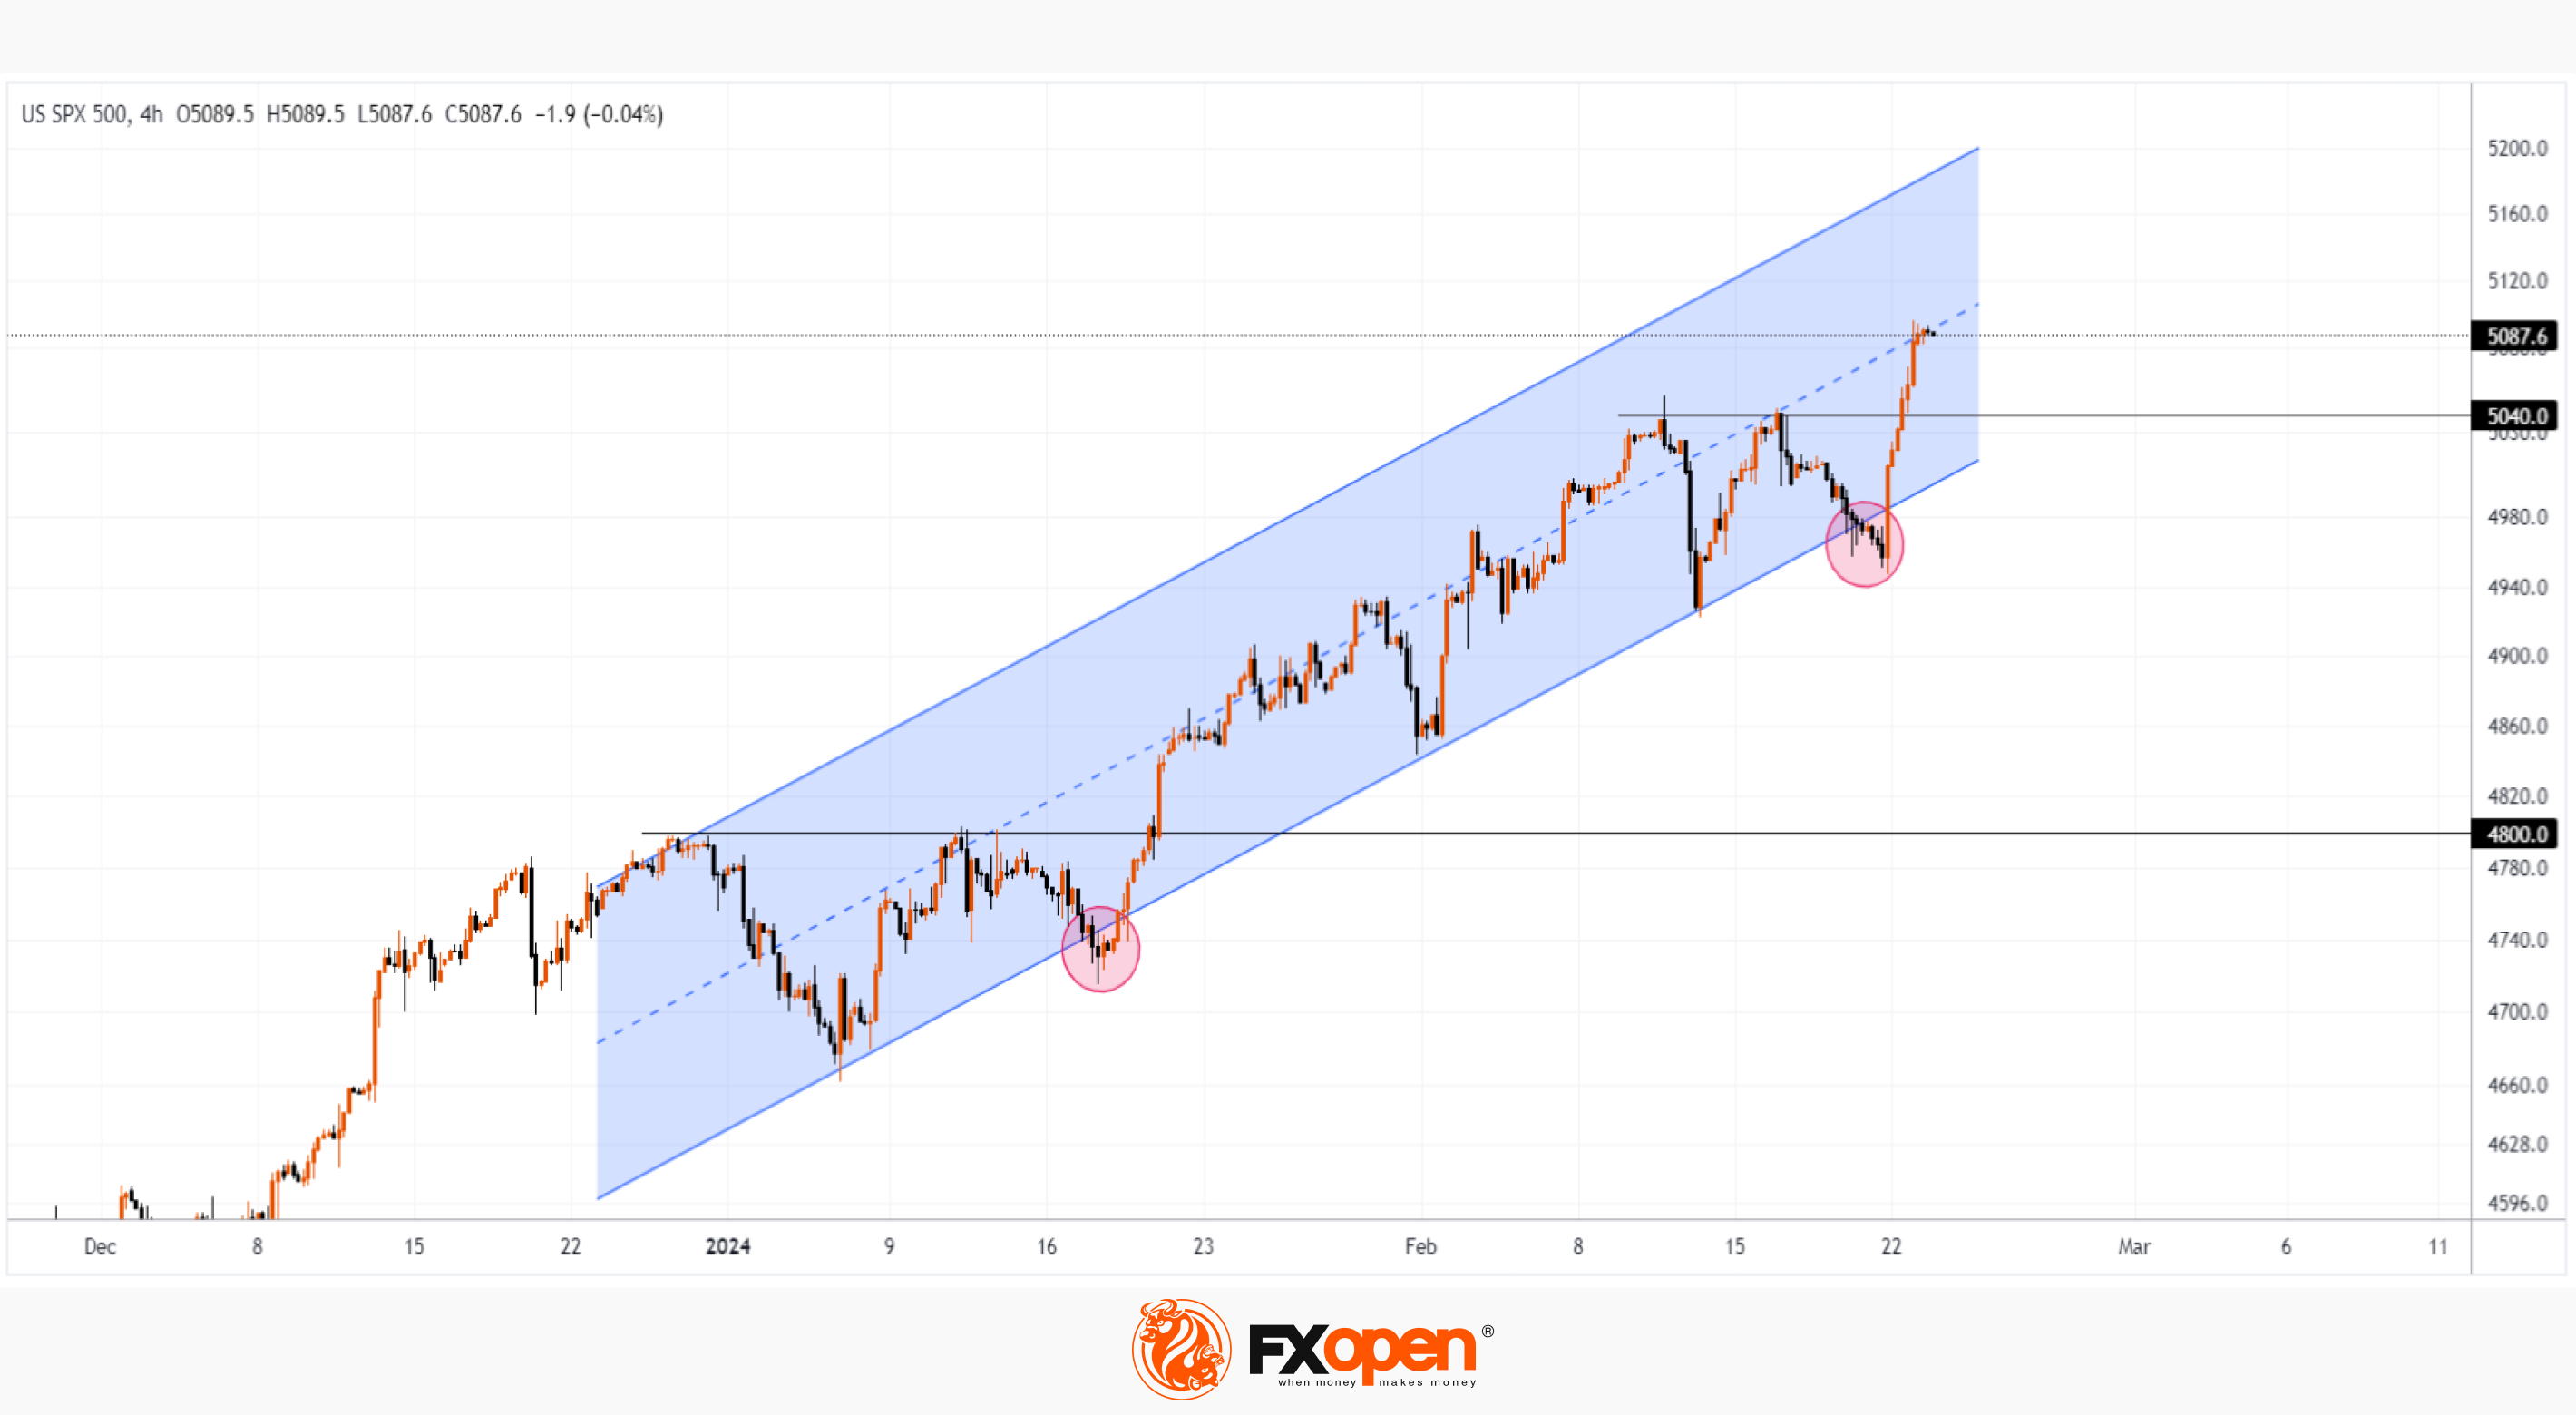
Technical analysis of the S&P 500 chart shows that the price continues to move within the ascending channel, which has been in effect since the beginning of 2024 (shown in blue).
Interestingly, the price of the S&P 500 made a small breakdown of the lower boundary on February 21; a similar pattern was observed on January 17 (both patterns are circled in red). In both cases:
→ after a false breakout of the lower border, a decisive breakout of the resistance level followed: in January this was the level of 4,800, yesterday, the level of 5,040 was broken.
→ The price showed signs of consolidation having reached the median line of the channel.
If the price of the S&P 500 continues to act according to the same scenario, we may see the formation of price consolidation above the broken level of 5,040 and its gradual increase along the median.
Trade global index CFDs with zero commission and tight spreads (additional fees may apply). Open your FXOpen account now or learn more about trading index CFDs with FXOpen.
This article represents the opinion of the Companies operating under the FXOpen brand only. It is not to be construed as an offer, solicitation, or recommendation with respect to products and services provided by the Companies operating under the FXOpen brand, nor is it to be considered financial advice.
Stay ahead of the market!
Subscribe now to our mailing list and receive the latest market news and insights delivered directly to your inbox.


Latest articles

Consolidation Ahead of NFP: Commodity Currencies Search for Direction
Commodity-linked currencies have entered a consolidation phase following recent directional moves, as market participants adopt a wait-and-see approach ahead of key US labour market data. Current price action reflects a balance between ongoing demand for the US dollar and attempts

The Real Driver Behind the Dollar Rally: Market Insights with Gary Thomson
The US dollar has been firm, but the drivers behind the move may be more complex than they first appear.
While geopolitical tension and shifts in risk sentiment play a role, current price behaviour seems increasingly influenced by inflation expectations

EUR/USD and USD/CHF Pull Back: Market Reacts to Fundamentals
European currencies have shown a recovery in recent trading sessions after their recent decline, displaying early signs of a reversal. The US dollar is weakening amid expectations surrounding upcoming US macroeconomic data, while market participants are reassessing their short-term positions