


FXOpen

Yesterday's data for last quarter showed that US GDP growth was estimated at 4.9% year-on-year, although GDP growth was expected to remain unchanged at 5.2%.
This disappointing performance could put pressure on the Fed to cut rates. After data is published:
→ the market has increased the likelihood of a rate cut by March to 83% from 79%, as evidenced by FedWatch;
→ the dollar index fell.
At the same time, the weakening dollar gave a bullish impetus to the price of gold, which exceeded the USD 2,050 level for the first time since December 4. By the way, returning to the analysis that we did on December 5, we note that the fan-shaped structure of trend lines remains relevant.
As predicted at the beginning of the month, the price broke below the USD 2,000 level and tested the lower line of the structure, followed by a price return above the psychological level.
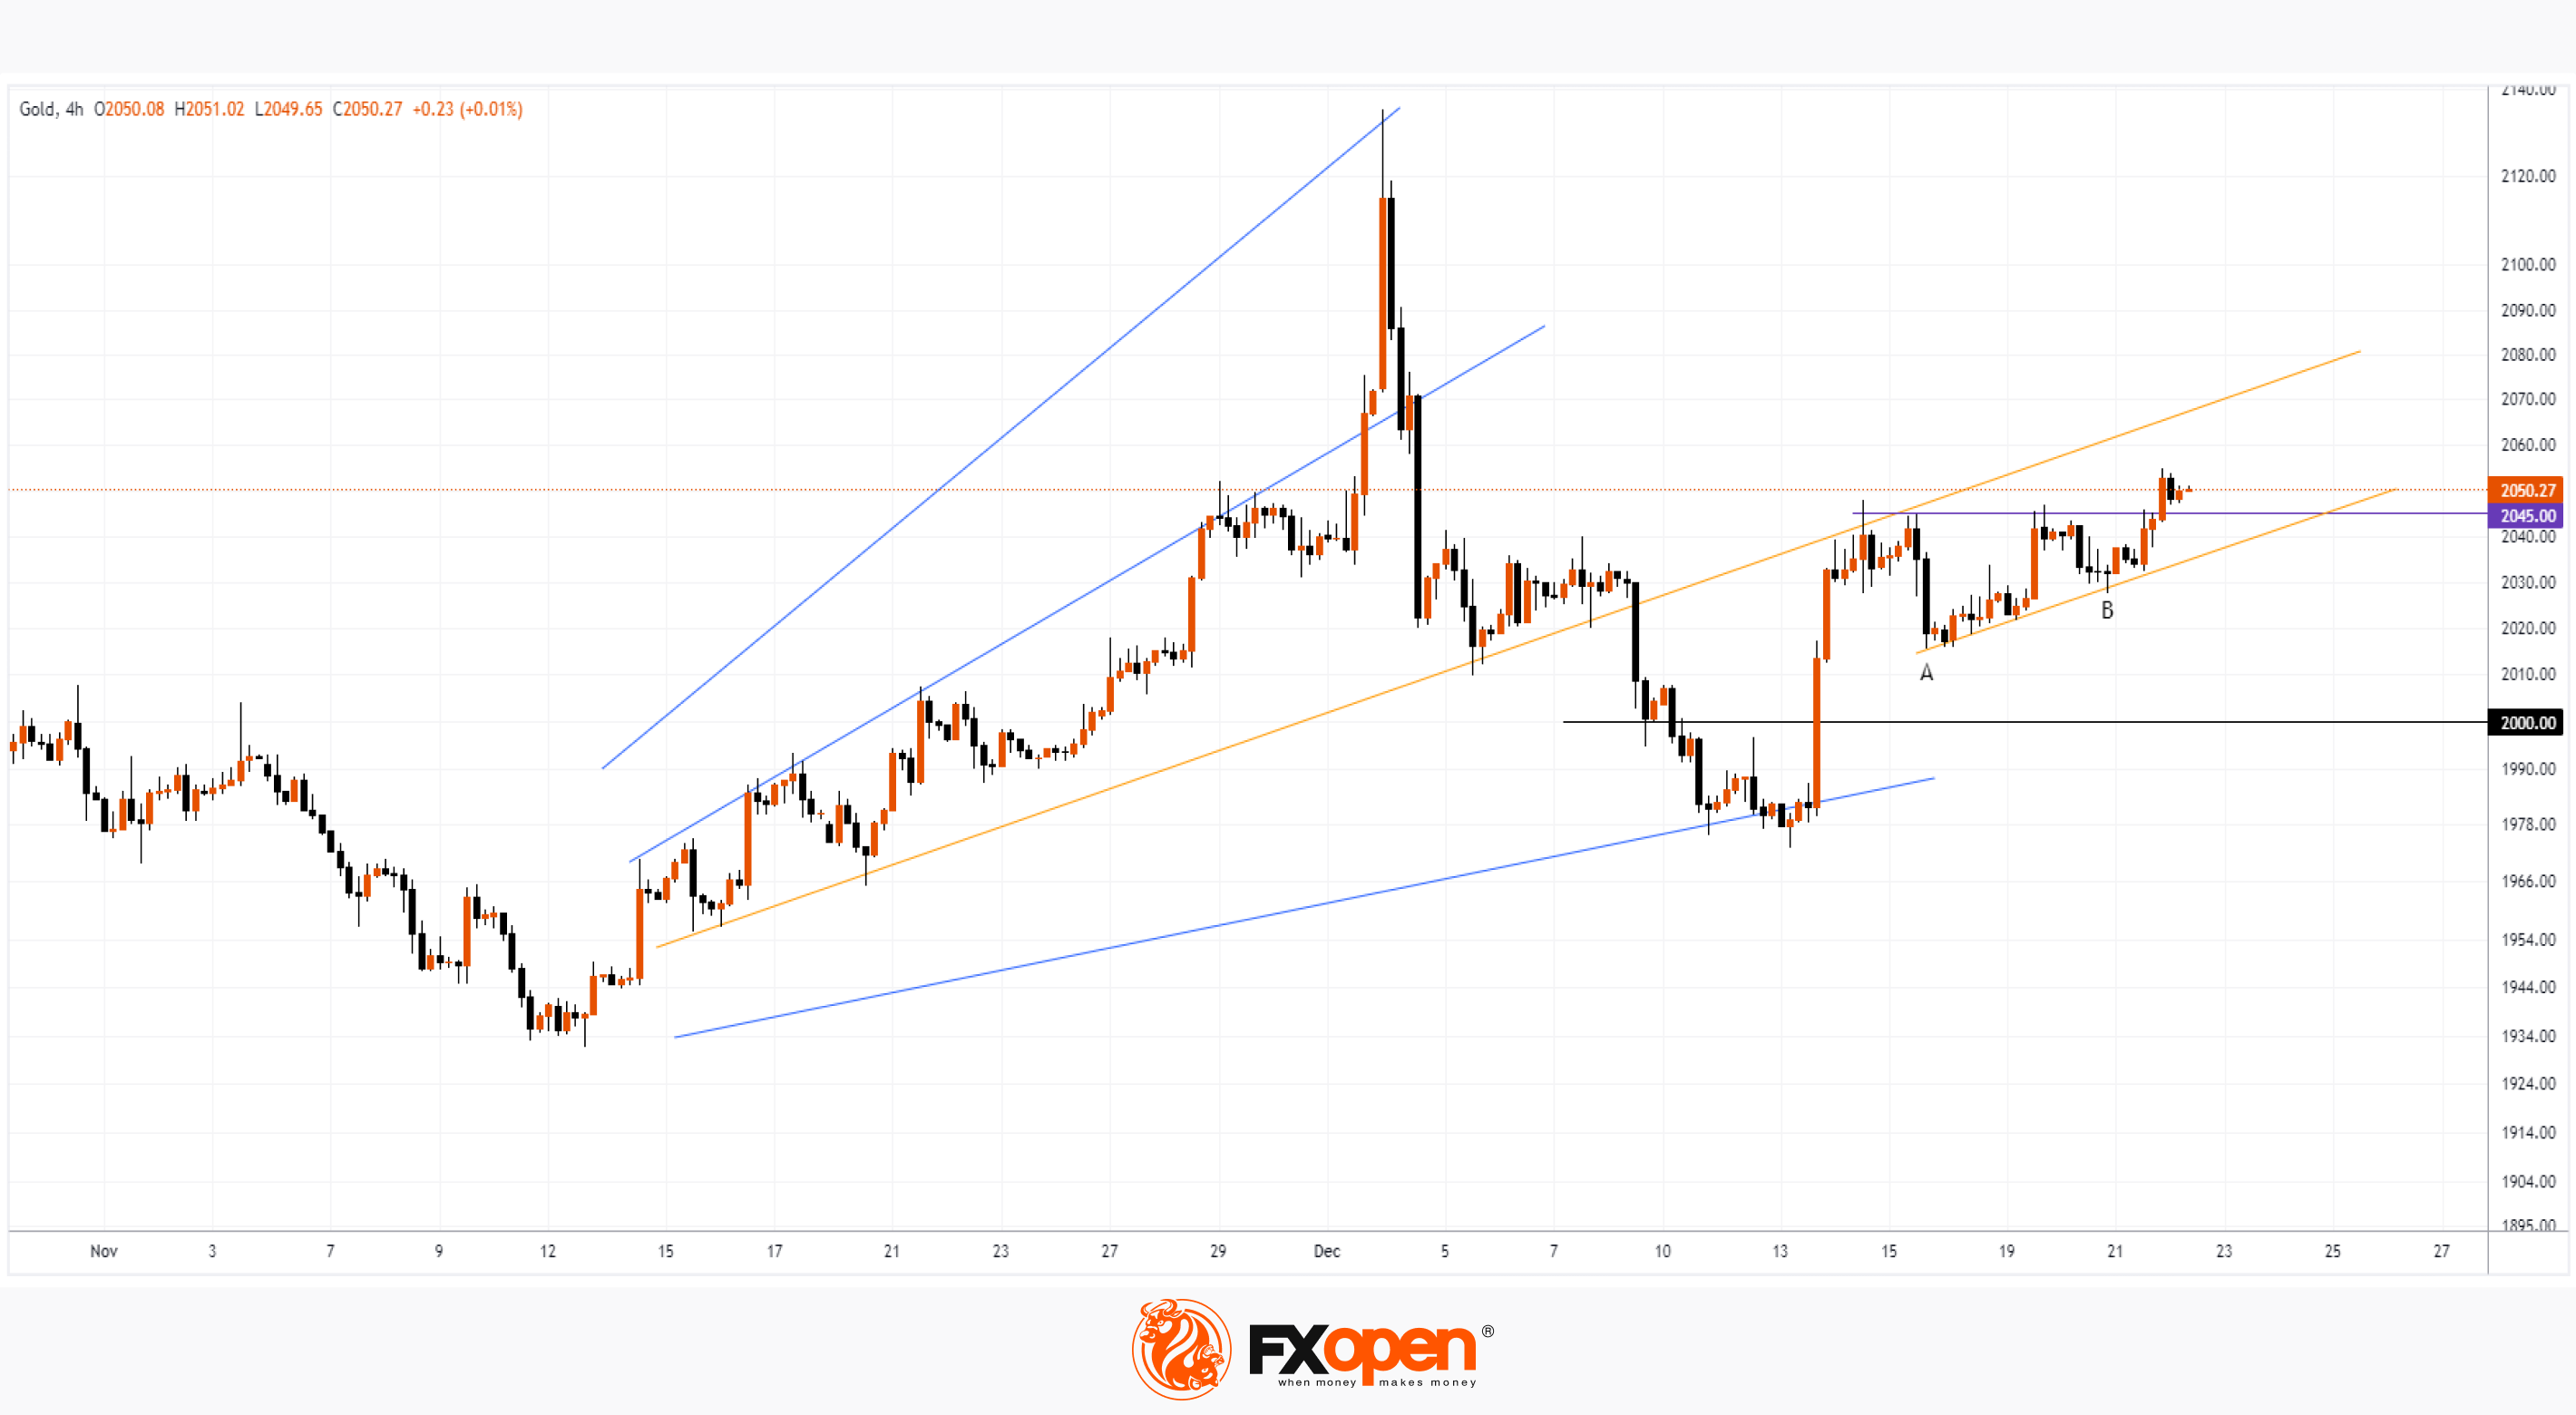
As the graph shows:
→ before breaking through the resistance at USD 2,045, the price formed a bullish cup- and-handle pattern. Rising A-B lows may indicate increased buying pressure;
→ the price may continue to develop within the channel shown by the yellow lines.
Further developments will most likely be influenced by the publication of Core PCE Price Index data (today at 16:30 GMT+3). It is possible that the bulls will try to reach the upper yellow line.
Start trading commodity CFDs with tight spreads (additional fees may apply). Open your trading account now or learn more about trading commodity CFDs with FXOpen.
This article represents the opinion of the Companies operating under the FXOpen brand only. It is not to be construed as an offer, solicitation, or recommendation with respect to products and services provided by the Companies operating under the FXOpen brand, nor is it to be considered financial advice.
Stay ahead of the market!
Subscribe now to our mailing list and receive the latest market news and insights delivered directly to your inbox.


Latest articles

Consolidation Ahead of NFP: Commodity Currencies Search for Direction
Commodity-linked currencies have entered a consolidation phase following recent directional moves, as market participants adopt a wait-and-see approach ahead of key US labour market data. Current price action reflects a balance between ongoing demand for the US dollar and attempts

The Real Driver Behind the Dollar Rally: Market Insights with Gary Thomson
The US dollar has been firm, but the drivers behind the move may be more complex than they first appear.
While geopolitical tension and shifts in risk sentiment play a role, current price behaviour seems increasingly influenced by inflation expectations

EUR/USD and USD/CHF Pull Back: Market Reacts to Fundamentals
European currencies have shown a recovery in recent trading sessions after their recent decline, displaying early signs of a reversal. The US dollar is weakening amid expectations surrounding upcoming US macroeconomic data, while market participants are reassessing their short-term positions