


FXOpen
According to Friday's data, in the US:
→ the unemployment rate rose to 3.9% (expected = 3.8%). The last time the level was this high was in February 2022.
→ the number of workers employed in the non-agricultural sector increased over the month by only 150k (+178k expected). The last time the figure was below 150k was in February 2021.
Published negative data clearly indicate a cooling of the labour market. Why then did the E-mini S&P-500 futures price end the week up about 5.5%, marking the best week of 2023?
The point is that market participants are increasingly convinced that the Fed will no longer tighten monetary policy. That is, interest rates have peaked, the next step should be to ease them, which will allow companies to grow.
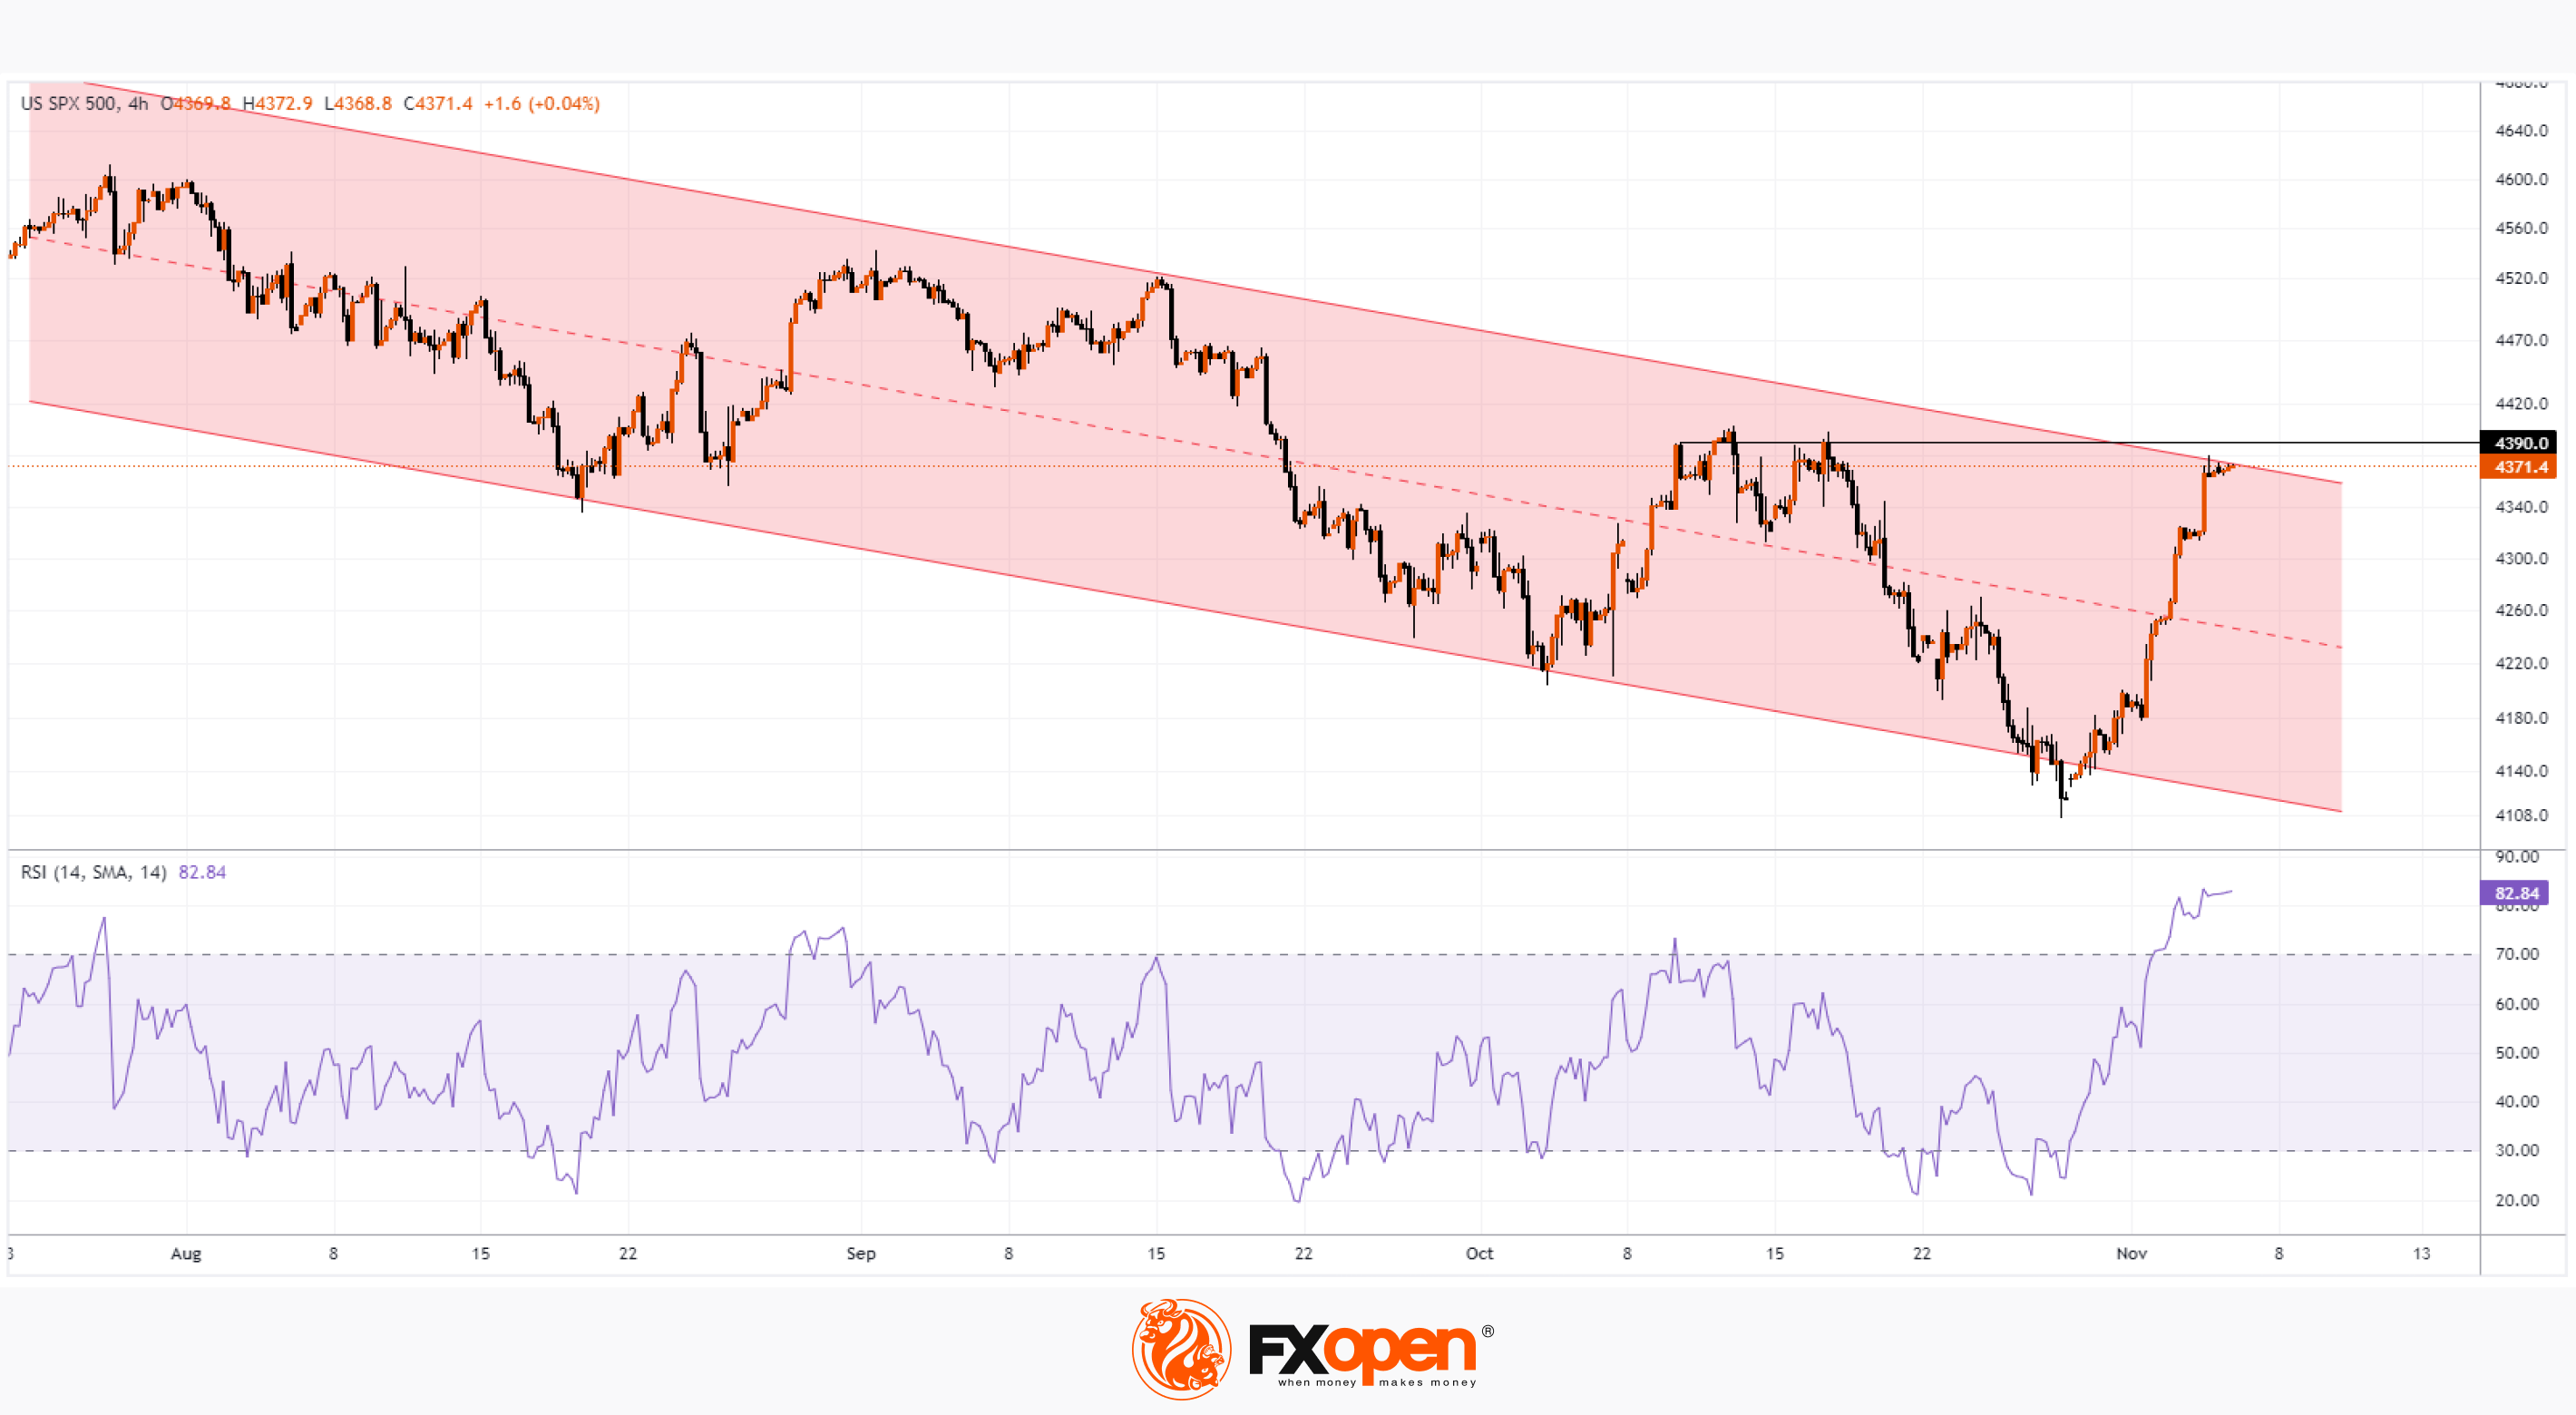
The 4-hour chart of the S&P 500 shows that the index price:
→ has reached the upper border of the descending channel, above which there is a resistance line from the October highs;
→ the RSI indicates severe overbought.
That is, the market is in a vulnerable position for the formation of a rollback from current price levels. If the price goes into a pullback, it will be an important test for the current positive interpretations of statistical data — is rising unemployment really a good thing for the stock market?
Trade global index CFDs with zero commission and tight spreads (additional fees may apply). Open your FXOpen account now or learn more about trading index CFDs with FXOpen.
This article represents the opinion of the Companies operating under the FXOpen brand only. It is not to be construed as an offer, solicitation, or recommendation with respect to products and services provided by the Companies operating under the FXOpen brand, nor is it to be considered financial advice.
Stay ahead of the market!
Subscribe now to our mailing list and receive the latest market news and insights delivered directly to your inbox.


Latest articles

Consolidation Ahead of NFP: Commodity Currencies Search for Direction
Commodity-linked currencies have entered a consolidation phase following recent directional moves, as market participants adopt a wait-and-see approach ahead of key US labour market data. Current price action reflects a balance between ongoing demand for the US dollar and attempts

The Real Driver Behind the Dollar Rally: Market Insights with Gary Thomson
The US dollar has been firm, but the drivers behind the move may be more complex than they first appear.
While geopolitical tension and shifts in risk sentiment play a role, current price behaviour seems increasingly influenced by inflation expectations

EUR/USD and USD/CHF Pull Back: Market Reacts to Fundamentals
European currencies have shown a recovery in recent trading sessions after their recent decline, displaying early signs of a reversal. The US dollar is weakening amid expectations surrounding upcoming US macroeconomic data, while market participants are reassessing their short-term positions