


S&P 500 Analysis: Powell Adds Bullish Momentum
FXOpen
As expected, the Fed left the rate unchanged. Market participants' attention was focused on Powell's press conference, as he said:
→ Risks have now become almost balanced;
→ Inflation expectations are at a good level.
The media publishes the opinions of experts who generally agree that although Jerome Powell has not ruled out the possibility of another rate increase, he does not seem to be very supportive of this idea. So the Fed is not as aggressive as it could be.
As a result, the probability of a rate hike in December has dropped to 20%, and the probability that the rate hike cycle has ended is at 70%.
The S&P 500 stock index reacted positively – the price rose at the end of trading. However, how long will the bullish momentum based on Powell's words last?
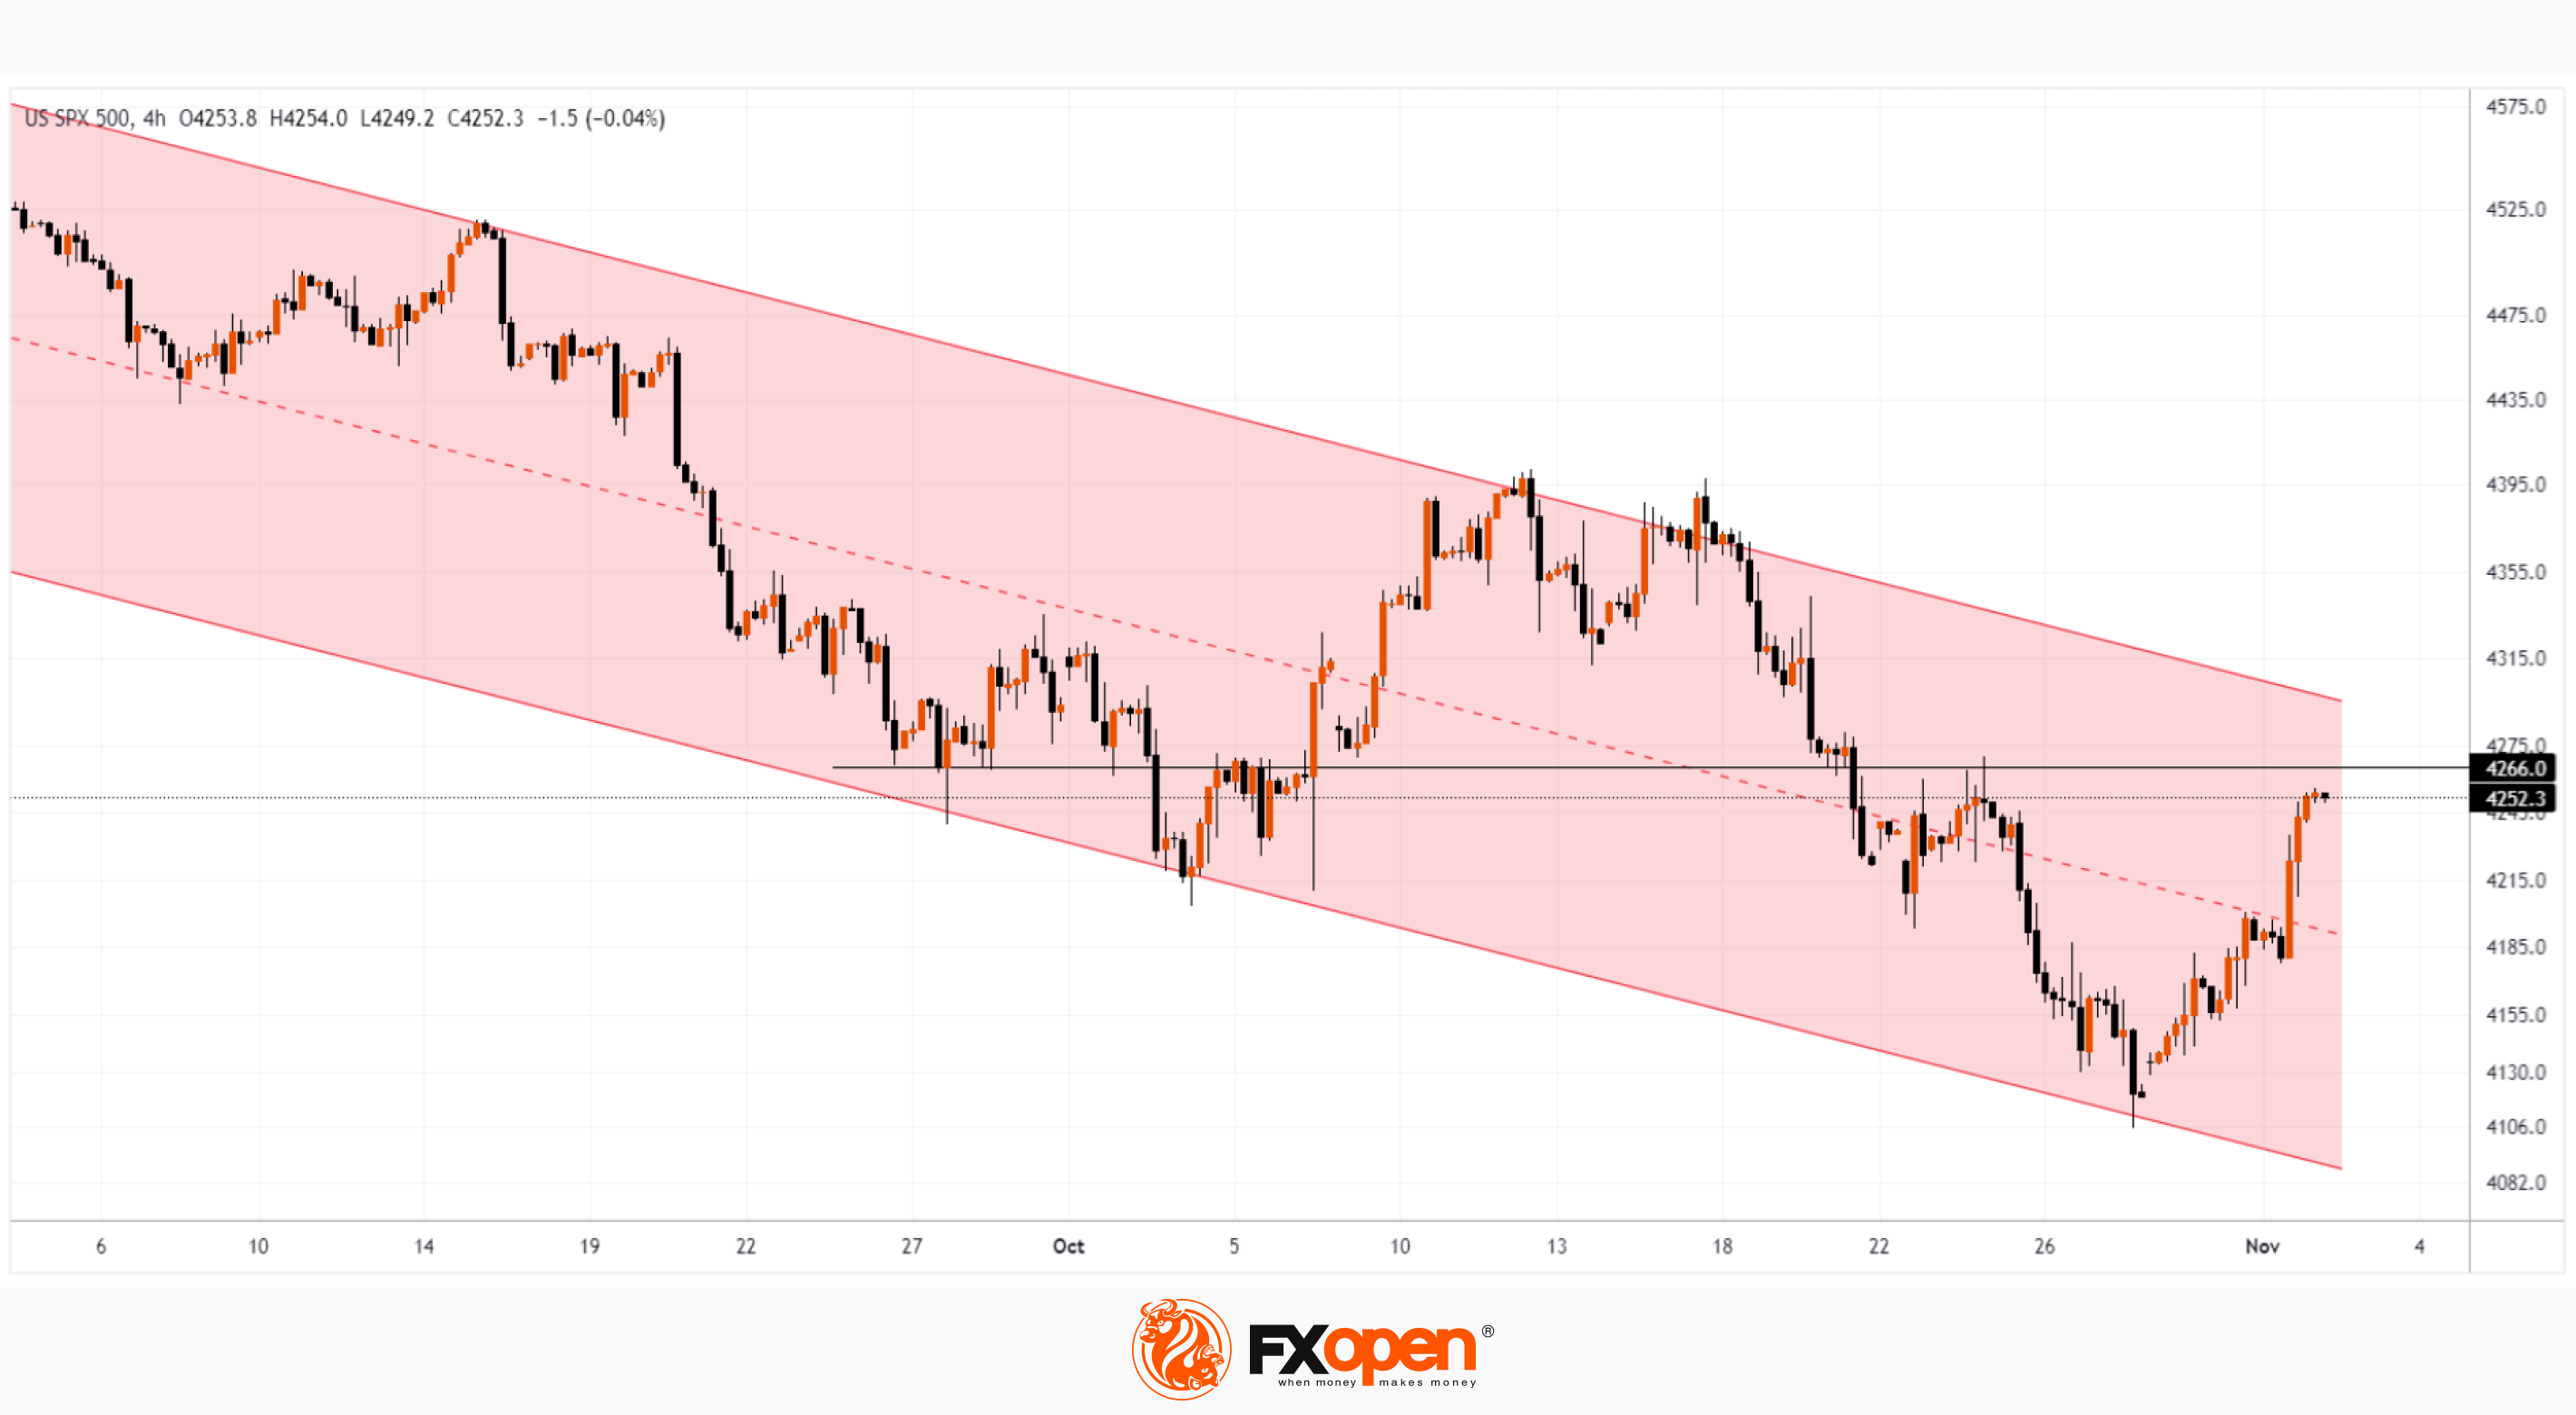
The graph shows that:
→ the price of the S&P 500 is still in a downward trend, judging by the channel (shown in red), and the upper limit of the channel, where we should expect the bears to intensify their efforts, is already close;
→ the price has risen to the important technical level 4,266, which has repeatedly affected it — perhaps now it will provide resistance;
→ tapering bullish candles late yesterday indicate that buyer activity may be drying up.
Today, as we note, a report on the activities of Apple, the largest company by capitalization, will be released. If it turns out to be worse than expected (for example, due to the dynamics of sales of the 15th iPhone), then the positivity from Powell’s words can be significantly (if not completely) won back by the bears.
Trade global index CFDs with zero commission and tight spreads (additional fees may apply). Open your FXOpen account now or learn more about trading index CFDs with FXOpen.
This article represents the opinion of the Companies operating under the FXOpen brand only. It is not to be construed as an offer, solicitation, or recommendation with respect to products and services provided by the Companies operating under the FXOpen brand, nor is it to be considered financial advice.
Stay ahead of the market!
Subscribe now to our mailing list and receive the latest market news and insights delivered directly to your inbox.


Latest articles

Weekly Market Insights with Gary Thomson: The Week of Central Banks and Earnings
In this video, we’ll explore the key economic events and market trends, shaping the financial landscape. Get ready for insights into financial markets to help you navigate the week ahead. Let’s dive in!
In this episode of Market

Intel at a Crossroads: Earnings Beat Meets Technical Resistance
Intel has just delivered its strongest quarter in over fifteen years, and the market reaction says it all. Q2 2026 revenue surged 25% year-over-year to $16.1 billion, crushing the consensus estimate of $14.42 billion, while adjusted EPS of

Tesla: Complex Range Structure Breaks Down Following Quarterly Earnings
Tesla released its Q2 2026 results after the market closed on 22 July. Revenue increased 26% year-on-year to $28.24 billion, while vehicle deliveries reached a record 480,126 units. However, operating margin fell sharply to 1.4%, down from