


S&P 500 Analysis: Worrisome Dynamics Ahead of Fed Decision
FXOpen
On the first of May, the US stock market turned out to be optimistic: the S&P 500 index exceeded the April maximum and approached the February maximum. The growth of the weekend was facilitated by the resolution of the crisis with the First Republic bank, which was bought by JPMorgan. According to former Treasury Secretary Larry Summers, most of the problems in the banking sector are over.
The opinion of Fundstrat analysts added to the positive. They indicated that the S&P 500 is up 9% YTD, has been in an uptrend for the past 7 months and has posted 2 quarters of growth in a row. This has never happened in a bear market, and according to the statistics, it is over. Analysts expect the index to return to highs at 4,750 by early 2024.
However… Yesterday, May 2, weak Job Openings data was published (actual – 9.59 million open vacancies, forecast – 9.74M, a month ago – 9.97M, a year ago – 11.5M). The sharp decline in supply in the US labor market led to a fall in stock prices and a rise in gold prices — presumably, investors preferred safer gold over stocks, as their fears of a recession intensified again against the backdrop of a weak labor market.
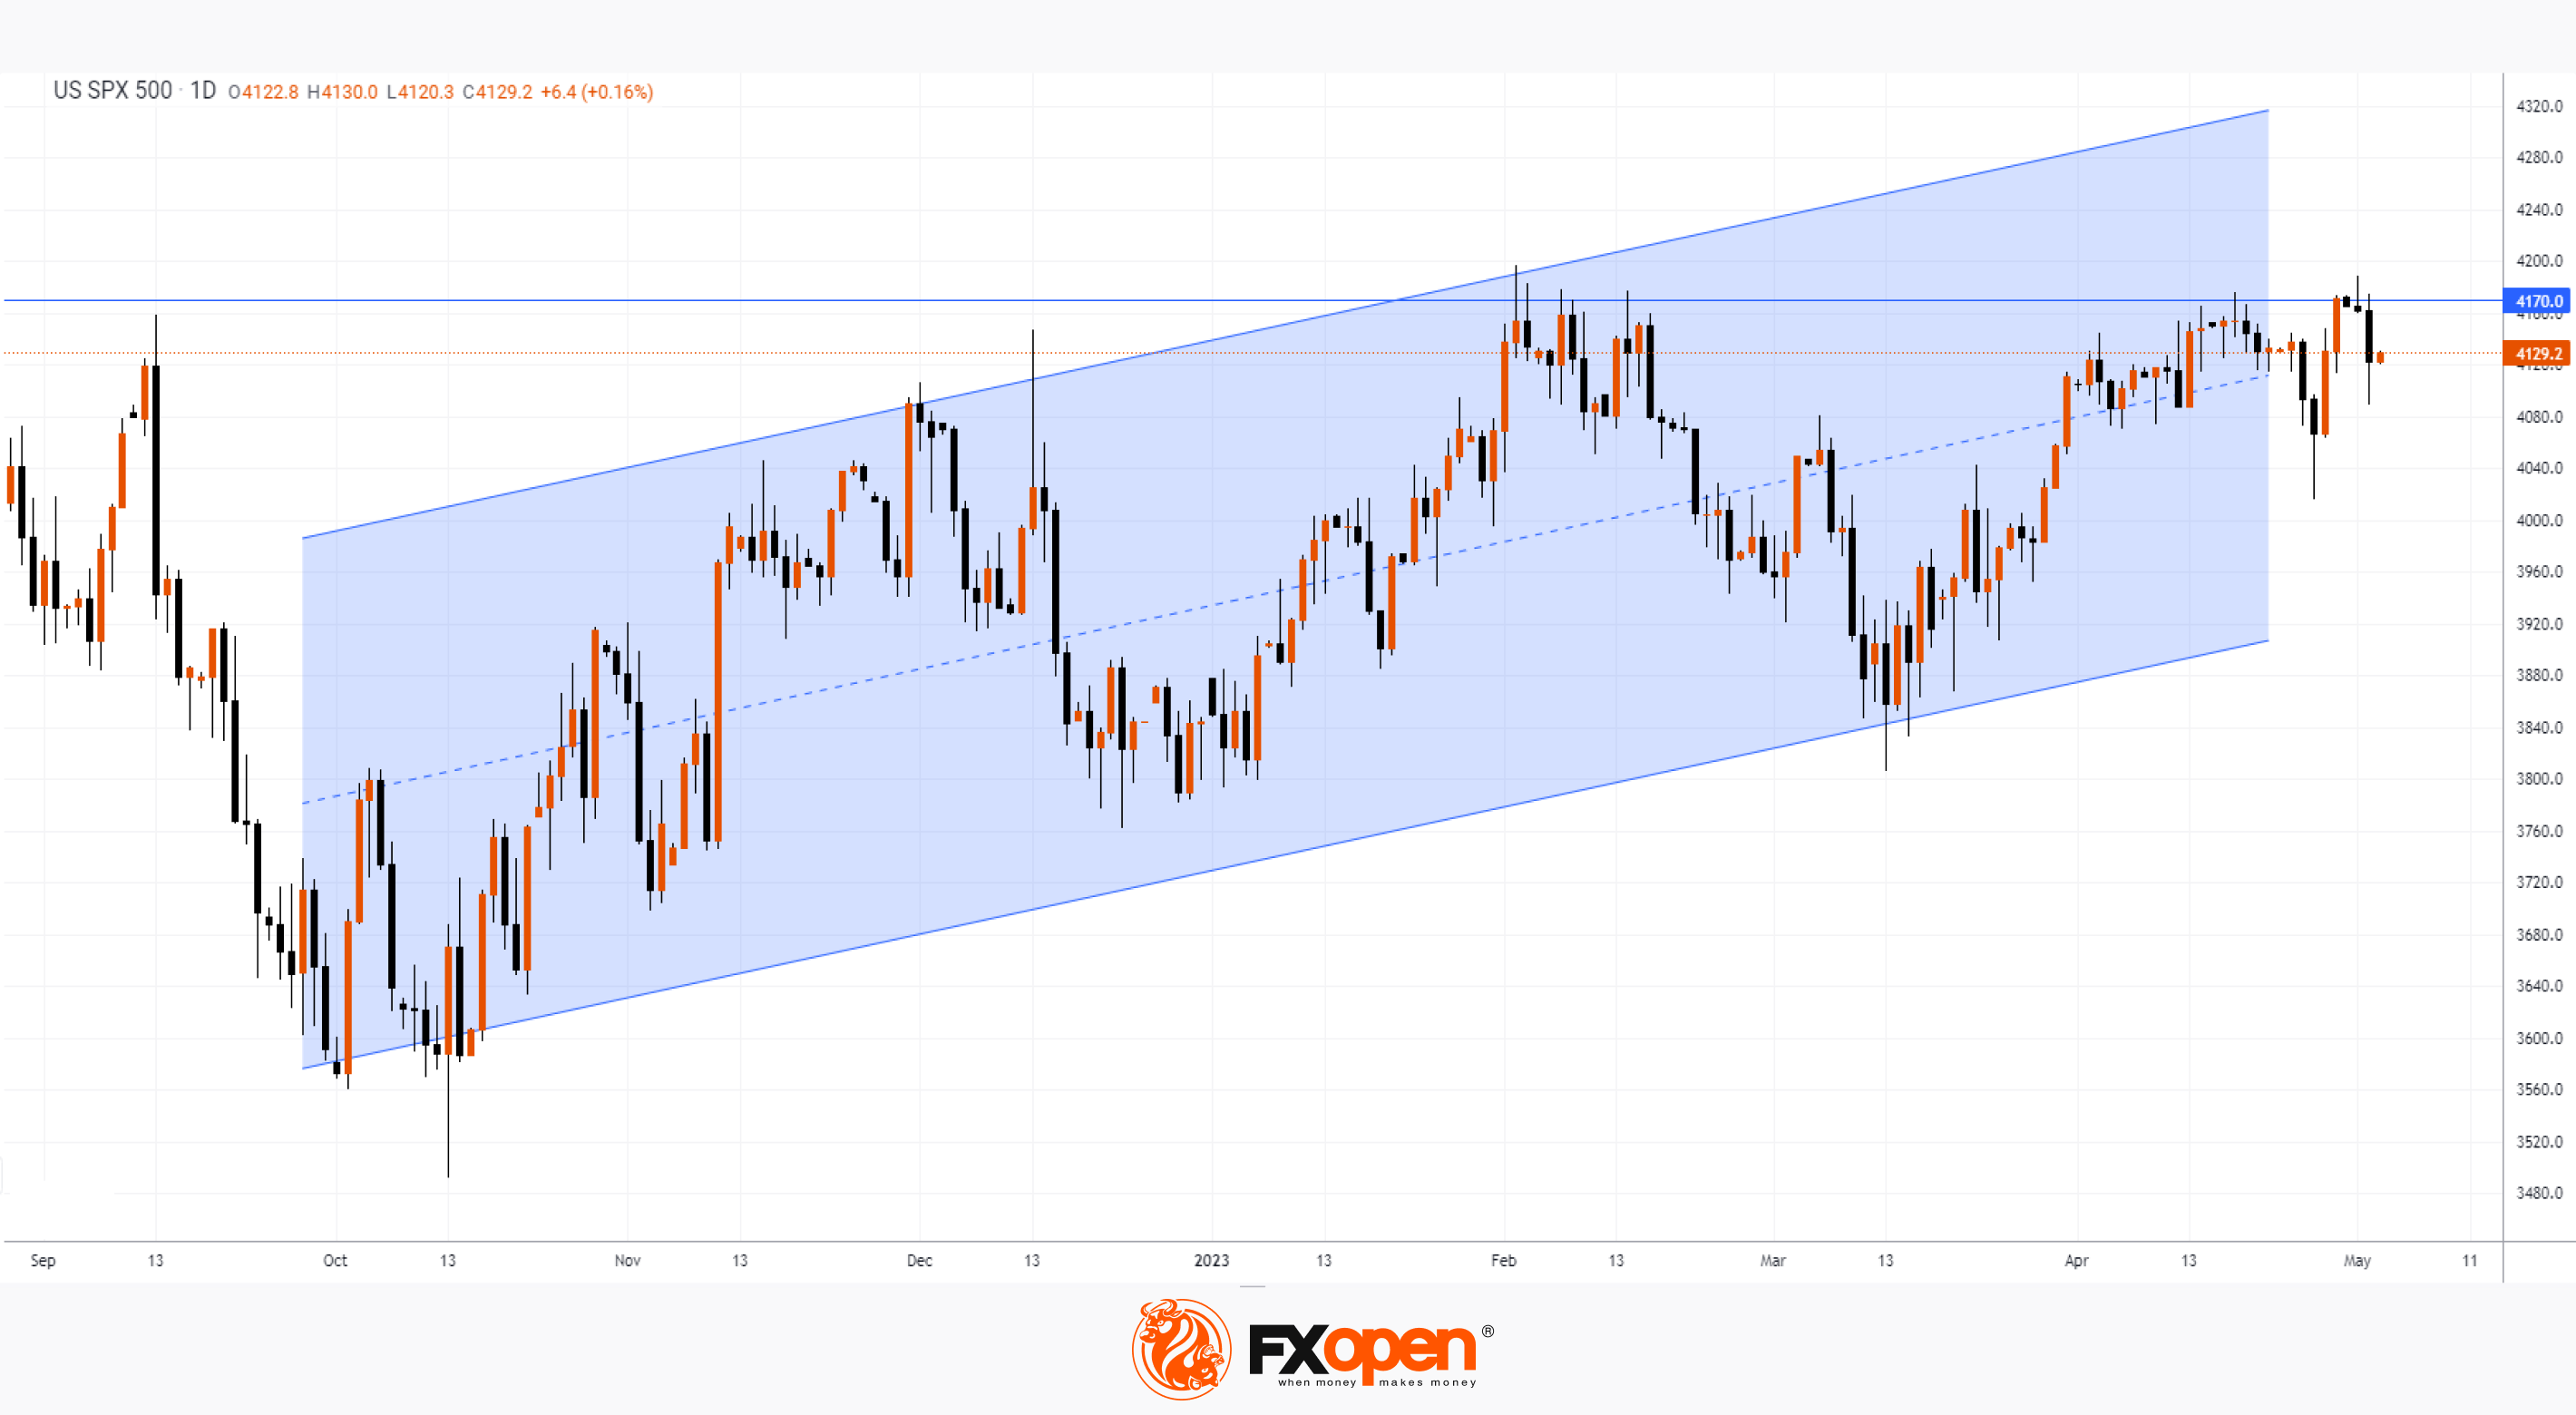
At the same time, the chart shows that the key resistance at 4170 continues to be relevant (as we wrote earlier, this level originates as early as 2022).
As a reminder, today we expect:
→ US release Fed interest rate decision at 21:00 (GMT+3)
→ Press conference US Federal Open Market Committee (FOMC) at 21:30 (GMT+3)
Get ready for bursts of volatility. Perhaps yesterday's bearish dynamics will intensify, and there will be no trace of the May Day positive.
This article represents FXOpen Companies’ opinion only, it should not be construed as an offer, solicitation, or recommendation with respect to FXOpen Companies’ products and services or as financial advice.
Trade global index CFDs with zero commission and tight spreads (additional fees may apply). Open your FXOpen account now or learn more about trading index CFDs with FXOpen.
This article represents the opinion of the Companies operating under the FXOpen brand only. It is not to be construed as an offer, solicitation, or recommendation with respect to products and services provided by the Companies operating under the FXOpen brand, nor is it to be considered financial advice.
Stay ahead of the market!
Subscribe now to our mailing list and receive the latest market news and insights delivered directly to your inbox.


Latest articles

DAX 40: consolidation amid technology sell-off
A wave of selling in the technology sector that emerged earlier this week has weighed on European equities. The trigger was investor concern over the profitability of large-scale debt-funded investments by major US tech companies in AI infrastructure. The Nasdaq

Euro Hits Fresh Yearly Lows Amid Dovish ECB Signals
The euro remains under pressure following weak macroeconomic data from the euro area and fresh signals that the European Central Bank is prepared to maintain a more accommodative monetary policy stance. Data released yesterday pointed to a deterioration in business

Pound at Key Levels: Markets Assess Impact of Political Uncertainty in the UK
The British pound remains under pressure following increased political uncertainty in the United Kingdom triggered by the Prime Minister’s resignation. Investors are assessing potential shifts in the political and economic policy outlook after the head of government stepped down,