


FXOpen

On Friday, the US unemployment data was released, as reported by ForexFactory:
→ The unemployment rate dropped from 4.2% to 4.1%;
→ The number of new jobs (Non-Farm Employment Change) increased by 256,000 over the month, although analysts had forecast an increase of 164,000 (previous value = 212,000).
According to Reuters, the strong labour market data strengthened the market participants' view that the Federal Reserve will be cautious in cutting interest rates in 2025.
Based on CME Group’s FedWatch tool, traders expect the Fed to reduce borrowing costs for the first time in June and then keep it at that level for the remainder of the year.
Expectations that tight monetary policy will persist longer than usual have led to bearish sentiment. As a result, the S&P 500 index (US SPX 500 mini on FXOpen) dropped below the 5,800 mark this morning, its lowest point since early November.
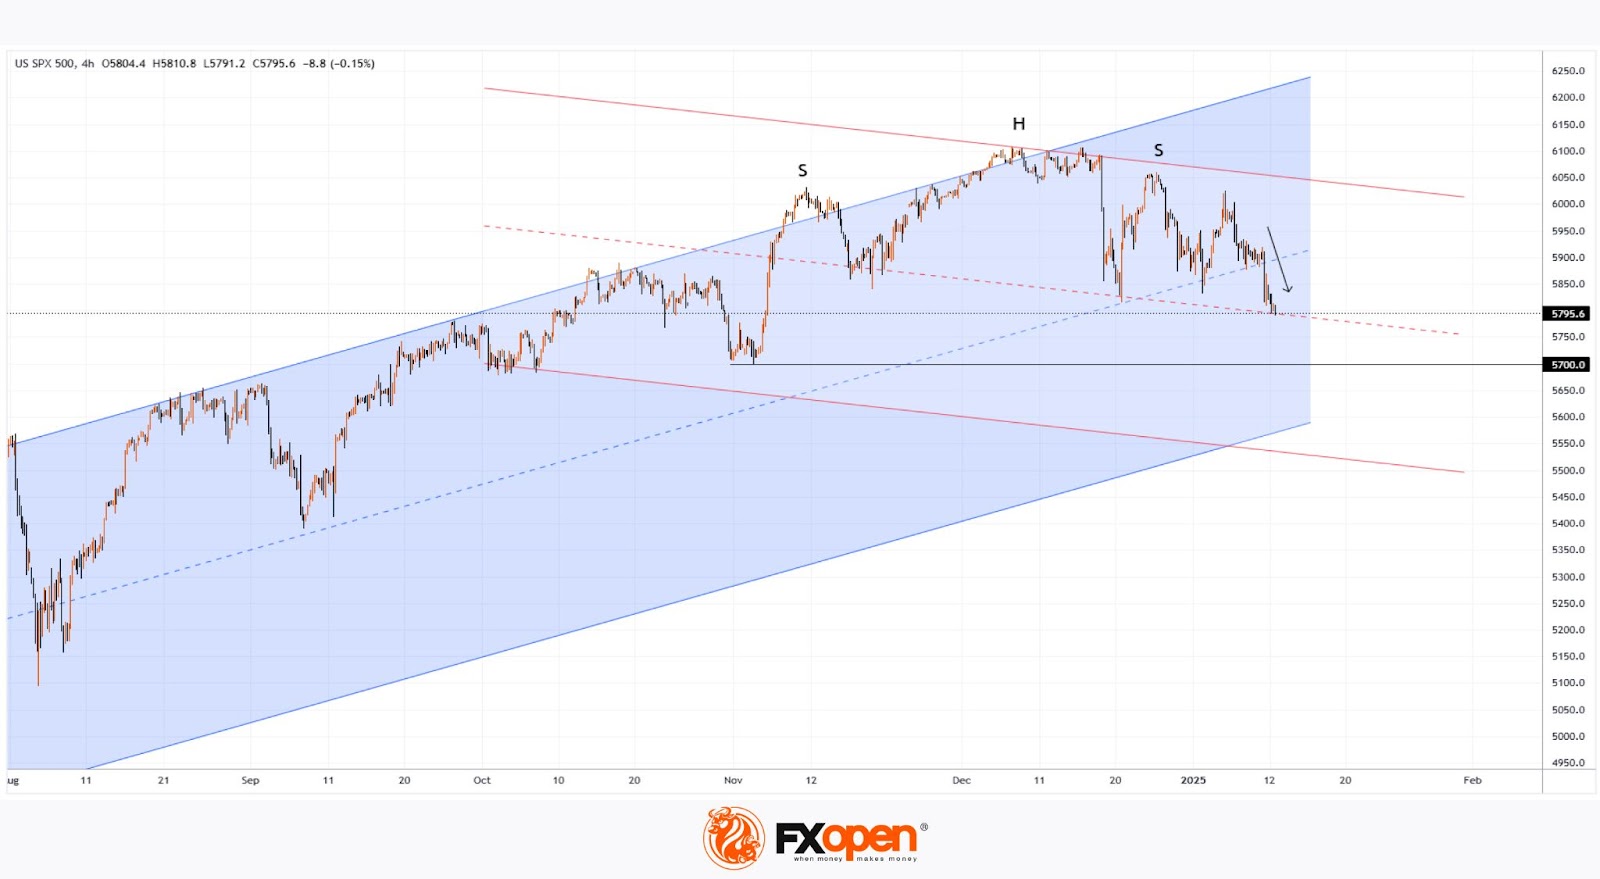
Technical analysis of the S&P 500 index (US SPX 500 mini on FXOpen) shows:
→ A bearish Head and Shoulders (SHS) pattern is visible on the chart;
→ The price has broken below the median of the ascending channel (marked in blue).
The strengthening bearish sentiment may lead to:
→ The price fluctuating within the descending channel, the boundaries of which are already visible (marked in red);
→ The median of this red channel currently acting as support.
It is possible that the intensification of bearish sentiment will result in the S&P 500 index (US SPX 500 mini on FXOpen) declining towards the 5,700 level, which may be reinforced by the proximity of the lower boundary of the ascending channel.
Trade global index CFDs with zero commission and tight spreads (additional fees may apply). Open your FXOpen account now or learn more about trading index CFDs with FXOpen.
This article represents the opinion of the Companies operating under the FXOpen brand only. It is not to be construed as an offer, solicitation, or recommendation with respect to products and services provided by the Companies operating under the FXOpen brand, nor is it to be considered financial advice.
Stay ahead of the market!
Subscribe now to our mailing list and receive the latest market news and insights delivered directly to your inbox.


Latest articles

Market Analysis: GBP/USD Dips Further As EUR/GBP Regains Traction
GBP/USD failed to climb above 1.3500 and corrected some gains. EUR/GBP started a decent increase and might aim for more gains above 0.8700.
Important Takeaways for GBP/USD and EUR/GBP Analysis Today
· The British Pound


Market Insights with Gary Thomson: Oil, US Retail Sales & NFP in Focus
In this video, we’ll explore the key economic events and market trends, shaping the financial landscape. Get ready for insights into financial markets to help you navigate the week ahead. Let’s dive in!
In this episode of Market