


S&P 500 Index Hits a New Record
FXOpen

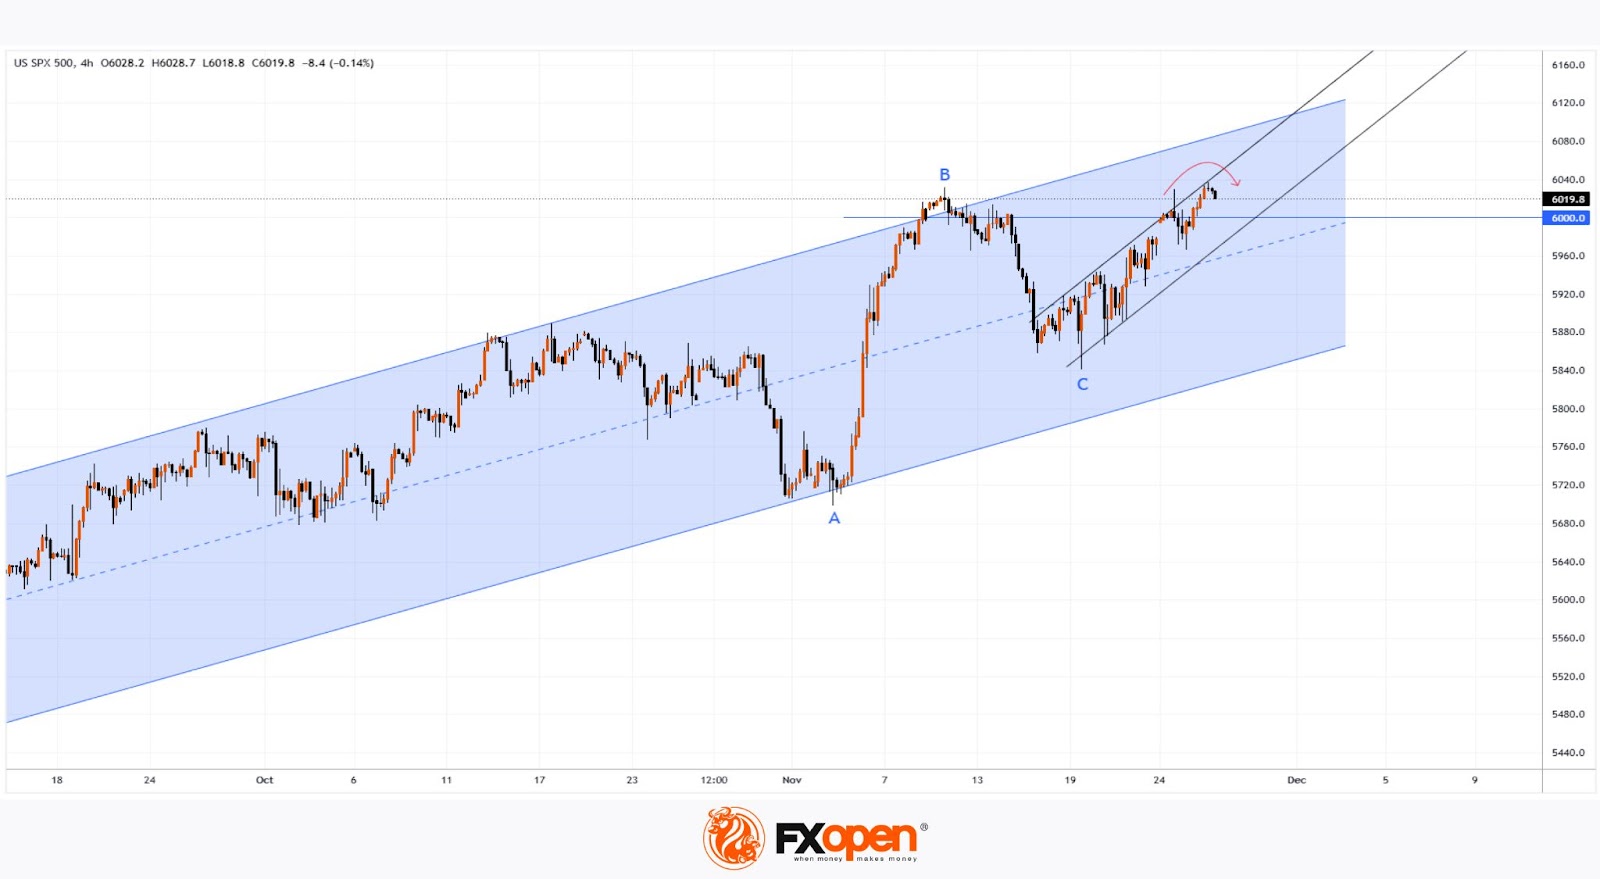
As shown on the S&P 500 chart (US SPX 500 mini on FXOpen), the stock index has reached a new record, surpassing the high set on 11 November.
Bullish sentiment on Wall Street was driven by the announcement that Trump has selected Scott Bessent, a renowned investor and hedge fund manager, as Treasury Secretary.
A technical analysis of the S&P 500 chart (US SPX 500 mini on FXOpen) reveals that the price is moving within two ascending channels:
→ The medium-term blue channel that began in August.
→ The short-term steeper channel (marked with black lines), which has pushed the price from the lower half of the blue channel to its upper half.
→ The decline from B to C retraced approximately 50% of the rise from A to B.
However, how robust is this bullish sentiment? Two bearish factors warrant attention:
→ Rising Cboe Skew Index: Reuters reports an increase in the Cboe Skew (.SKEWX), a financial tool reflecting investor caution. Concerns may stem from potential inflation spikes, Trump’s tariffs, and other risks.
→ Possible False Breakout: The chart indicates that after setting a new high, the price turned downward (marked with a red arrow), potentially signalling a false bullish breakout of the previous high.
The strength of demand will become clearer following the market's reaction to the release of the Personal Consumption Expenditures (PCE) index, scheduled for today at 18:00 GMT+3.
Trade global index CFDs with zero commission and tight spreads (additional fees may apply). Open your FXOpen account now or learn more about trading index CFDs with FXOpen.
This article represents the opinion of the Companies operating under the FXOpen brand only. It is not to be construed as an offer, solicitation, or recommendation with respect to products and services provided by the Companies operating under the FXOpen brand, nor is it to be considered financial advice.
Stay ahead of the market!
Subscribe now to our mailing list and receive the latest market news and insights delivered directly to your inbox.


Latest articles

AUD/CAD: Months of Indecision — Is a Breakout Finally Coming?
The Australian dollar has clawed back most of its end-of-June losses, when it touched three-month lows against the greenback amid escalating Middle East tensions. Since then, sentiment has improved: the RBA's Assistant Governor Sarah Hunter signalled the board stands ready

USD/JPY: Battling at the Top of the Triangle
On 3 July, Japan's Finance Minister, Satsuki Katayama, stated that the Ministry of Finance remains in close contact with US authorities regarding developments in USD/JPY as the yen traded near its weakest level in almost 40 years. Similar verbal

Dow Jones (DJIA): Consolidation Beyond the Trend
Federal Reserve Chair Kevin Warsh testified before Congress on 14–15 July, reaffirming the Fed's commitment to bringing inflation back to target while providing no clear guidance on the future path of interest rates. Meanwhile, June inflation data came in