


FXOpen

At 21:00 GMT+3 today, the Federal Reserve will announce its interest rate decision, followed by Jerome Powell’s press conference. The rate is widely expected to be cut from 4.25%–4.50% to 4.00%–4.25%.
This will conclude a prolonged intrigue fuelled by President Trump:
→ his constant criticism of Powell for pursuing an “overly tight” policy;
→ the decision to dismiss Federal Reserve Board member Lisa Cook, which markets perceived as direct pressure on the regulator’s independence.
In anticipation of the outcome, traders are showing optimism. The S&P 500 index (US SPX 500 mini on FXOpen) reached a new all-time high yesterday, climbing above 6,640 points. This morning the price pulled back slightly, which can be interpreted as a short-term correction ahead of a key event. Effectively, the market has already priced in the expected policy easing, viewing it as a catalyst for further growth.
Technical Analysis of the S&P 500 Chart
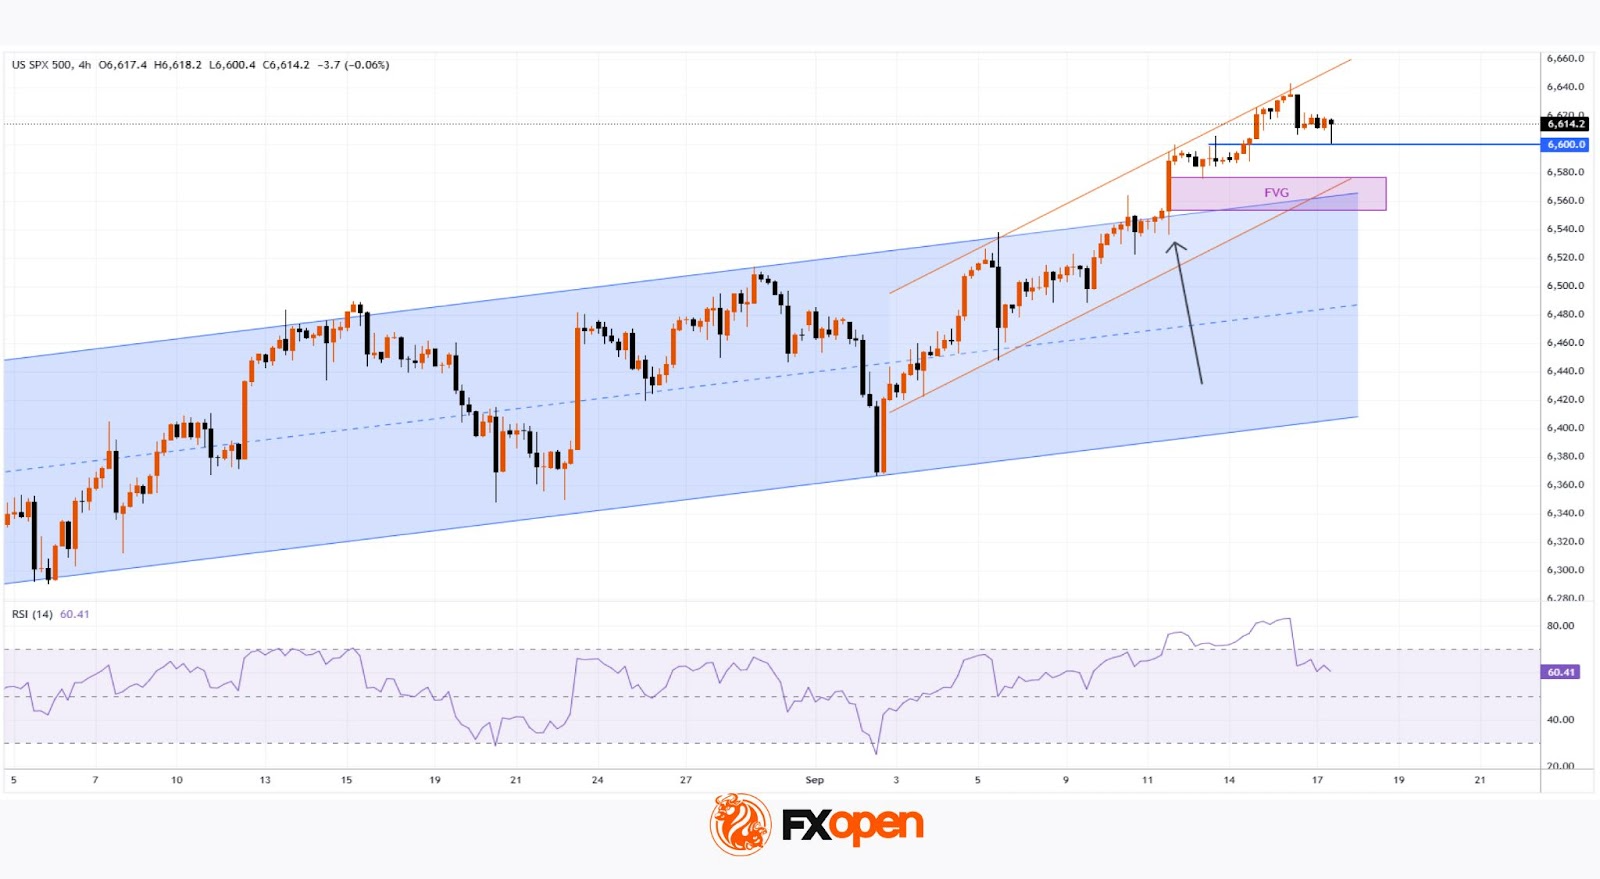
Six days ago, when analysing the 4-hour chart of the S&P 500 (US SPX 500 mini on FXOpen), we noted that:
→ the price was oscillating within an upward channel (marked in blue);
→ in September, the index has been following a steep bullish trajectory (marked in orange), with its lower line showing signs of support.
Since then, favourable inflation data helped the bulls break above the channel’s upper boundary (highlighted with an arrow).
Possible scenarios
Bullish perspective:
→ The breakout candle above the blue channel has a long body, signalling strong buying momentum – an imbalance, also known in Smart Money Concept (SMC) as a Fair Value Gap (FVG).
→ The local level of 6,600, once resistance, has now turned into support; the next target could be the psychological level of 6,700.
→ The price is consolidating above the blue channel’s upper boundary, indicating robust demand.
Bearish perspective:
→ The upper boundary of the orange channel may act as resistance.
→ The RSI indicator, although off overbought territory, remains close to it – potentially deterring buyers from entering at elevated prices.
Taking all of this into account, the current balance could easily be disrupted once the Fed announces its rate decision – arguably the most significant event of the month in the economic calendar. Be prepared for spikes in volatility, as sharp moves in either direction are possible.
Trade global index CFDs with zero commission and tight spreads (additional fees may apply). Open your FXOpen account now or learn more about trading index CFDs with FXOpen.
This article represents the opinion of the Companies operating under the FXOpen brand only. It is not to be construed as an offer, solicitation, or recommendation with respect to products and services provided by the Companies operating under the FXOpen brand, nor is it to be considered financial advice.
Stay ahead of the market!
Subscribe now to our mailing list and receive the latest market news and insights delivered directly to your inbox.


Latest articles

EUR/USD Chart Analysis: Pair Recovers Ahead of Fed News
On 10 March, analysing the EUR/USD chart, we:
→ considered the long-term descending channel, which remains relevant;
→ noted that the sequence of lower lows A–H was broken with the appearance of a higher peak I, with 1.1680 potentially

Nvidia (NVDA) Shares Set a March High
Nvidia shares experienced heightened volatility yesterday, with the price jumping to a March high during the Nvidia GTC 2026 conference, where Jensen Huang made several major announcements. According to media reports:
→ Nvidia unveiled a next-generation platform named after the astronomer

XTI/USD Chart Analysis: WTI Oil Price Fluctuates Near $100
For the third Monday in a row, trading in the oil market has opened with a bullish gap, although this time it is not as wide as the gap seen, for example, on 9 March. The reason for the volatility