


S&P 500 Index: Latest Analysts’ Forecasts
FXOpen

Over the three spring months, the S&P 500 (US SPX 500 mini on FXOpen) rose by 3.5% – not the worst result, but it might be disappointing considering that in the first two months of the year the index increased by 7.8%.
This trend suggests that:
→ the rally driven by interest in AI is slowing down;
→ stock market participants are concerned that Fed rates will remain high.
What could be the scenarios for future developments until the end of the year and beyond?
The media publish fresh forecasts on the S&P 500 (US SPX 500 mini on FXOpen) price from Wall Street analysts:
→ MarketWatch: Analysts at JP Morgan believe that the growth potential is exhausted and the market may “hit a wall” preventing further growth. They maintain a forecast that the index value at the end of 2024 will be 4200 points.
→ MarketWatch: Experts at Wells Fargo think it would be too optimistic to expect stocks to reach new record highs ahead of the US elections in November; however, further growth related to the election results looks likely in 2025. They estimate the index could reach a record 5700 points by the end of next year.
→ BusinessInsider: According to Capital Economics, the index could rise if Treasury yields fall and the momentum from AI adoption remains strong. Their forecast is 6500 points by the end of 2025, followed by a sharp correction in 2026.
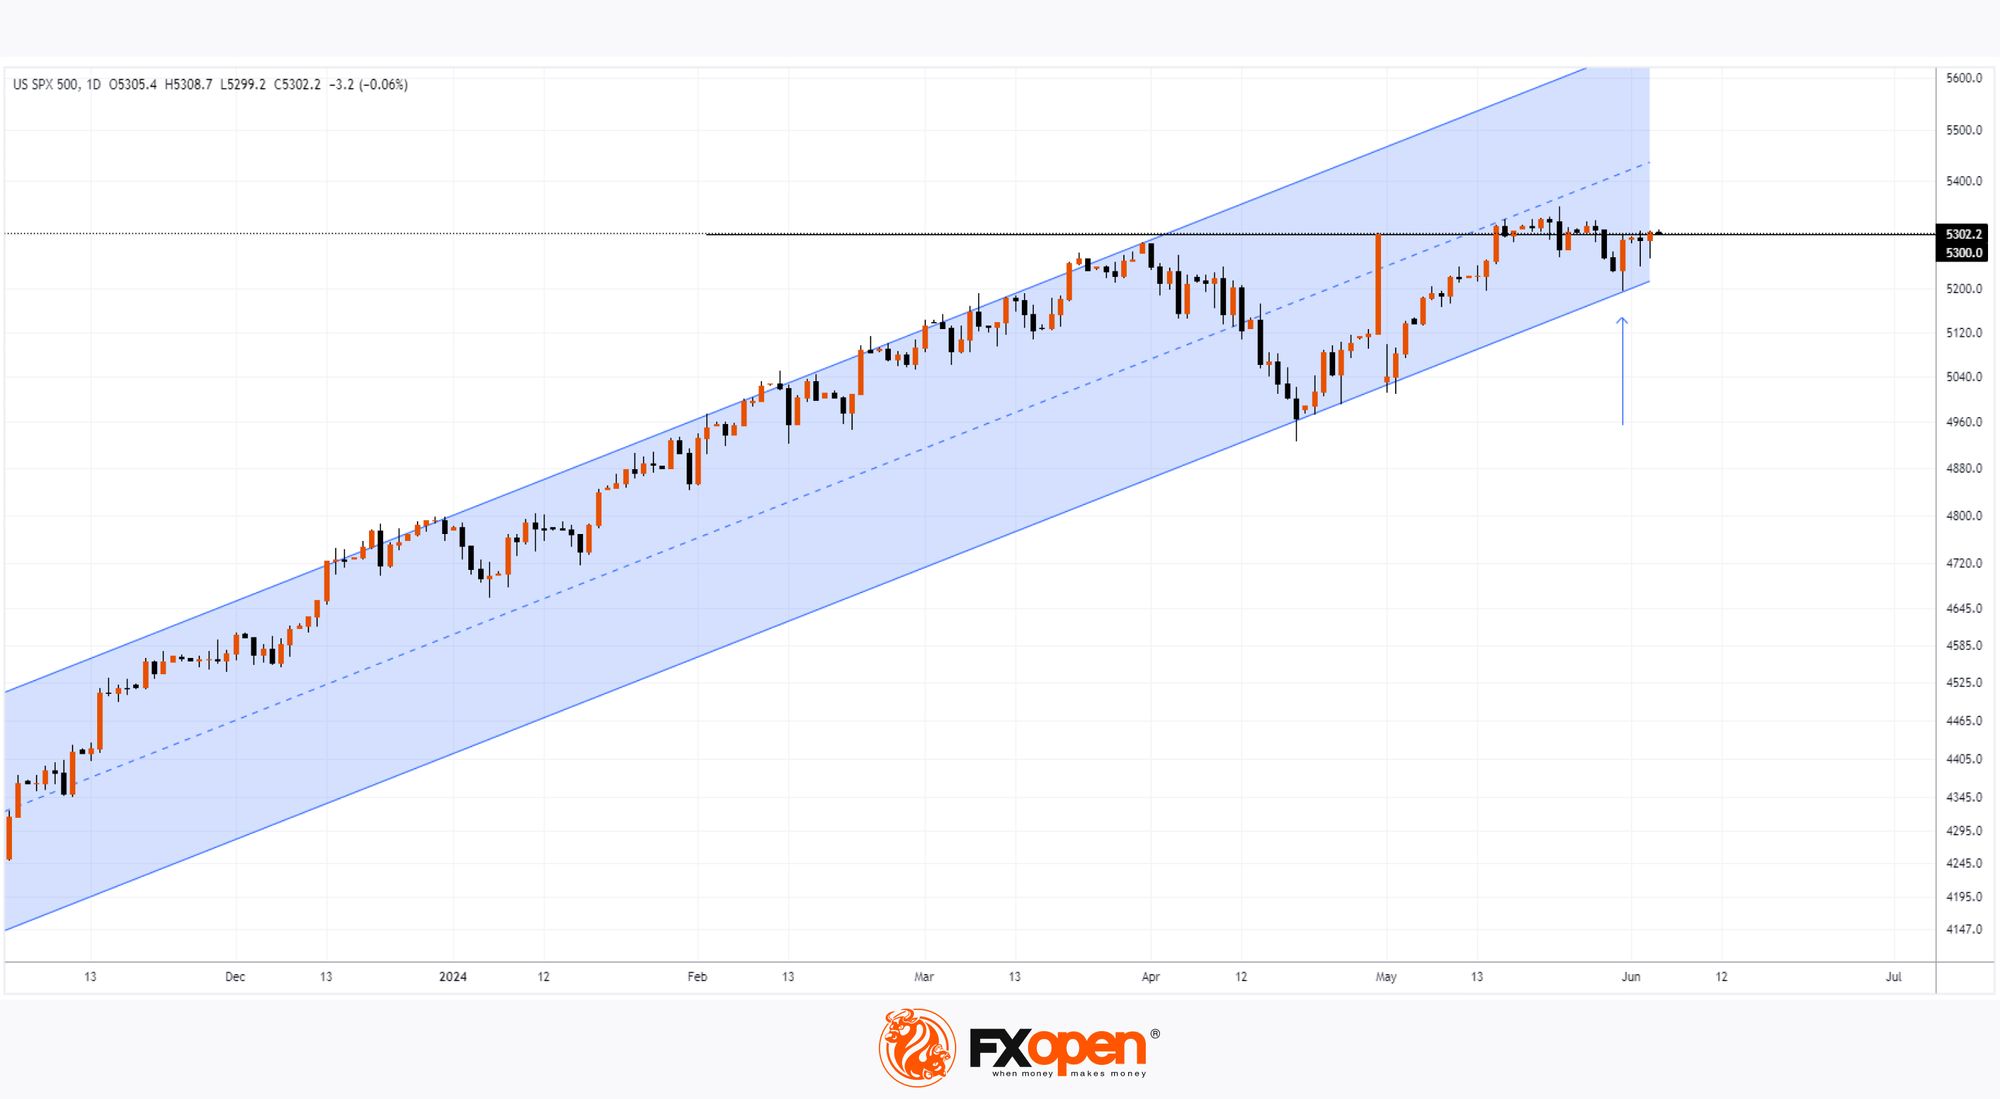
Technical analysis of the daily chart of the S&P 500 (US SPX 500 mini on FXOpen) today shows that:
→ the market is in an uptrend (marked by a blue channel);
→ the price has moved from the upper half to the lower half of the channel – a sign of weakening bullish strength;
→ the 5300 level acts as resistance;
→ the broad bullish candle on 31 May (marked by an arrow) closing near its highs indicates strong demand at the lower boundary of the channel, but whether it will be sufficient to overcome the 5300 level and consolidate above it will largely depend on the upcoming Fed rate decision (scheduled for 12 June).
Trade global index CFDs with zero commission and tight spreads (additional fees may apply). Open your FXOpen account now or learn more about trading index CFDs with FXOpen.
This article represents the opinion of the Companies operating under the FXOpen brand only. It is not to be construed as an offer, solicitation, or recommendation with respect to products and services provided by the Companies operating under the FXOpen brand, nor is it to be considered financial advice.
Stay ahead of the market!
Subscribe now to our mailing list and receive the latest market news and insights delivered directly to your inbox.


Latest articles

AI Valuations Are Back in the Spotlight
Artificial intelligence remains the dominant investment theme of 2026, but investors are increasingly questioning whether AI stock valuations are keeping pace with reality.
💰 Big Tech continues to invest at an unprecedented scale, with hyperscaler AI spending projected to exceed $800

AUD/CAD: Months of Indecision — Is a Breakout Finally Coming?
The Australian dollar has clawed back most of its end-of-June losses, when it touched three-month lows against the greenback amid escalating Middle East tensions. Since then, sentiment has improved: the RBA's Assistant Governor Sarah Hunter signalled the board stands ready

USD/JPY: Battling at the Top of the Triangle
On 3 July, Japan's Finance Minister, Satsuki Katayama, stated that the Ministry of Finance remains in close contact with US authorities regarding developments in USD/JPY as the yen traded near its weakest level in almost 40 years. Similar verbal