


S&P 500 Index Rises to Psychological Level
FXOpen

The US stock market experienced an upswing following the release of inflation data yesterday. According to ForexFactory:
→ The annual Consumer Price Index (CPI) matched expectations at 2.9%.
→ The monthly Core CPI came in at 0.2%, below analysts' forecast of 0.3%.
Market participants interpreted this as a positive signal, leading to the S&P 500 index (US SPX 500 mini on FXOpen) gaining over 1% in the first 30 minutes after the data release.
As reported by Reuters:
→ Concerns about inflation eased, reviving hopes for a potential Federal Reserve rate cut, buoyed by a strong start to the earnings season (which we will cover in more detail later);
→ However, the rally may be short-lived, as inflation in the US remains uncomfortably high and could increase further due to aggressive tariff and tax policies under the new Trump administration;
→ Analysts caution that the Federal Reserve's rate is likely to remain unchanged for some time.
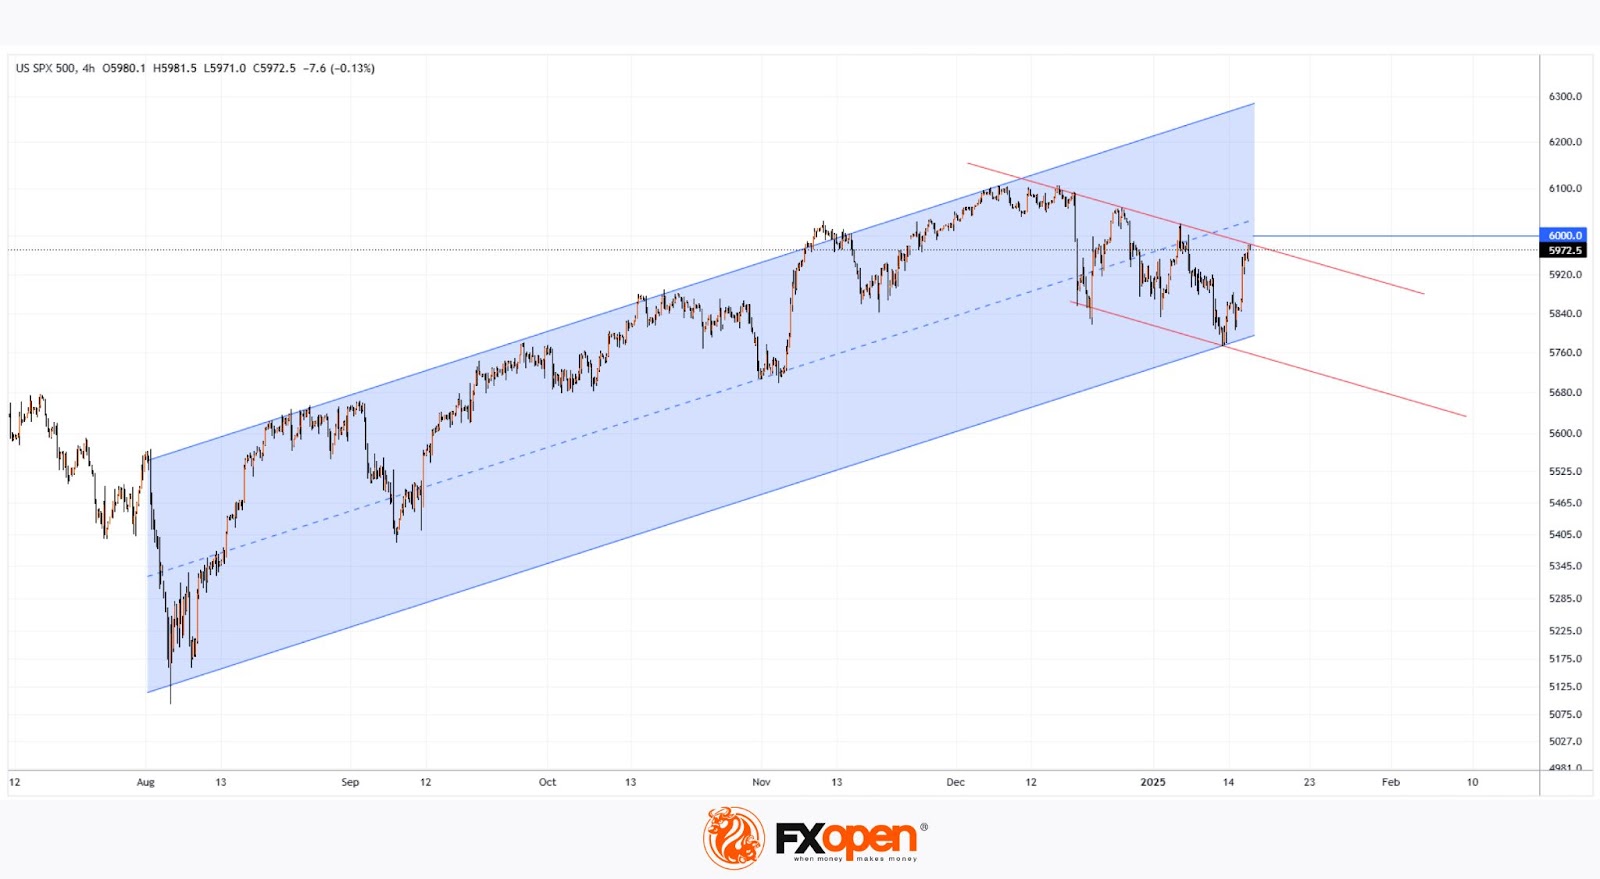
Technical analysis of the S&P 500 index chart (US SPX 500 mini on FXOpen) shows that since early August—when the Japanese stock market crash triggered concerns of a global recession, dragging US equities lower—the price has been in an upward trend, marked by a blue channel. The January mid-month low has provided a more precise point to define the lower boundary of this channel.
From this perspective, traders should note that the current S&P 500 price has reached a resistance zone, which consists of:
→ The median line of the blue channel;
→ The psychological level of 6,000 points;
→ The upper red line, drawn through the local highs of December 2024 and January 2025, suggesting that the decline beginning on 18th December could be viewed as an intermediate correction within the blue ascending channel.
This resistance area may serve as a key test of the bulls' determination to complete the correction and resume the upward trend.
Trade global index CFDs with zero commission and tight spreads (additional fees may apply). Open your FXOpen account now or learn more about trading index CFDs with FXOpen.
This article represents the opinion of the Companies operating under the FXOpen brand only. It is not to be construed as an offer, solicitation, or recommendation with respect to products and services provided by the Companies operating under the FXOpen brand, nor is it to be considered financial advice.
Stay ahead of the market!
Subscribe now to our mailing list and receive the latest market news and insights delivered directly to your inbox.


Latest articles

Weekly Market Insights with Gary Thomson: US Inflation, UK GDP, Chair Warsh Testimony, and Earnings
In this video, we’ll explore the key economic events and market trends, shaping the financial landscape. Get ready for insights into financial markets to help you navigate the week ahead. Let’s dive in!
In this episode of Market

GBP/AUD Analysis: The Tug-of-War Begins
Oil is back in the driver's seat, and both the pound and the aussie are feeling its grip. The Bank of England held rates at 3.75% in June, but with UK inflation at 2.8% and crude oil climbing

Australian Dollar Holds Above the Current Market Profile
The minutes from the Reserve Bank of Australia's (RBA) June meeting, released on 30 June, suggested that policymakers are not yet ready to rule out further policy tightening. Board members noted persistent excess demand and broad-based inflationary pressures across the