


S&P 500 Index Sets Record High
FXOpen

As shown by the S&P 500 chart (US SPX 500 mini on FXOpen), the stock index:
→ has increased by approximately 3.5% since the start of the year;
→ surpassed its previous all-time highs set in December.
Market participants’ optimism was driven by:
→ a strong start to earnings season and expectations of robust reports from major tech companies;
→ statements made by Donald Trump at the Davos forum, where the US president urged Saudi Arabia to lower oil prices and expressed the view that interest rates should be reduced. Overall, such measures are expected to foster economic growth.
Reuters quoted Lindsay Bell, Chief Strategist at 248 Ventures: buyers "like the idea of interest rates coming down, of oil prices coming down. All in all, the market is optimistic the more they hear about Trump policies. We're just seeing a reflection of that optimism."
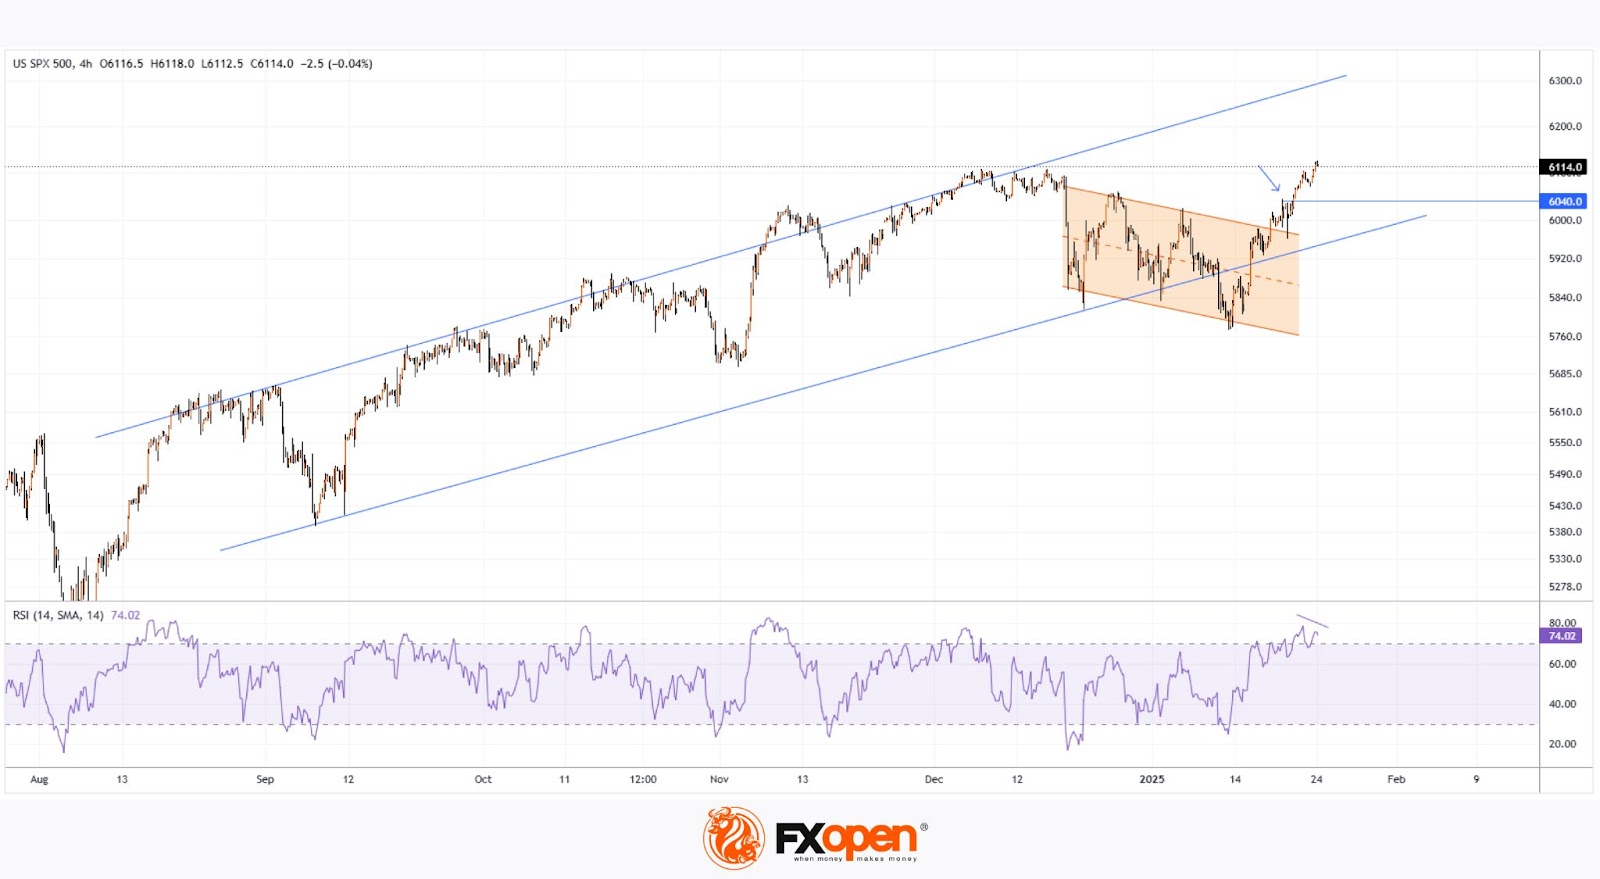
Technical analysis of the S&P 500 chart (US SPX 500 mini on FXOpen) reveals:
→ At the end of 2024, price fluctuations formed an ascending channel (marked by blue lines).
→ The December dip appears to be a correction within the prevailing uptrend. Bears managed to push the price below the lower blue line, but only for about a week.
→ After breaking the correction channel (shaded in orange), bulls faced brief resistance (indicated by the arrow) at the 6040 level.
→ The RSI indicator is in the overbought zone and signals divergence. This suggests a minor pullback could occur, potentially testing the aforementioned 6040 level.
Trade global index CFDs with zero commission and tight spreads (additional fees may apply). Open your FXOpen account now or learn more about trading index CFDs with FXOpen.
This article represents the opinion of the Companies operating under the FXOpen brand only. It is not to be construed as an offer, solicitation, or recommendation with respect to products and services provided by the Companies operating under the FXOpen brand, nor is it to be considered financial advice.
Stay ahead of the market!
Subscribe now to our mailing list and receive the latest market news and insights delivered directly to your inbox.


Latest articles

USD/CAD: One Trendline Away From Deciding the Next Move
After several strongly positive weeks, USD/CAD has stalled over the past few sessions, entering a phase of uncertainty.
On the dollar side, Fed Chair Kevin Warsh has struck a firm tone, reaffirming the 2% inflation target and pushing back

Amazon: New Bond Issuance to Fund AI Infrastructure
On 7 July, Amazon announced an eight-tranche bond offering worth at least $25 billion, with the proceeds expected to finance the construction of data centres and the expansion of its artificial intelligence infrastructure. Investor demand peaked at $62 billion, highlighting

Weekly Market Insights with Gary Thomson: US Inflation, UK GDP, Chair Warsh Testimony, and Earnings
In this video, we’ll explore the key economic events and market trends, shaping the financial landscape. Get ready for insights into financial markets to help you navigate the week ahead. Let’s dive in!
In this episode of Market