


Silver Price Falls Below $50
FXOpen

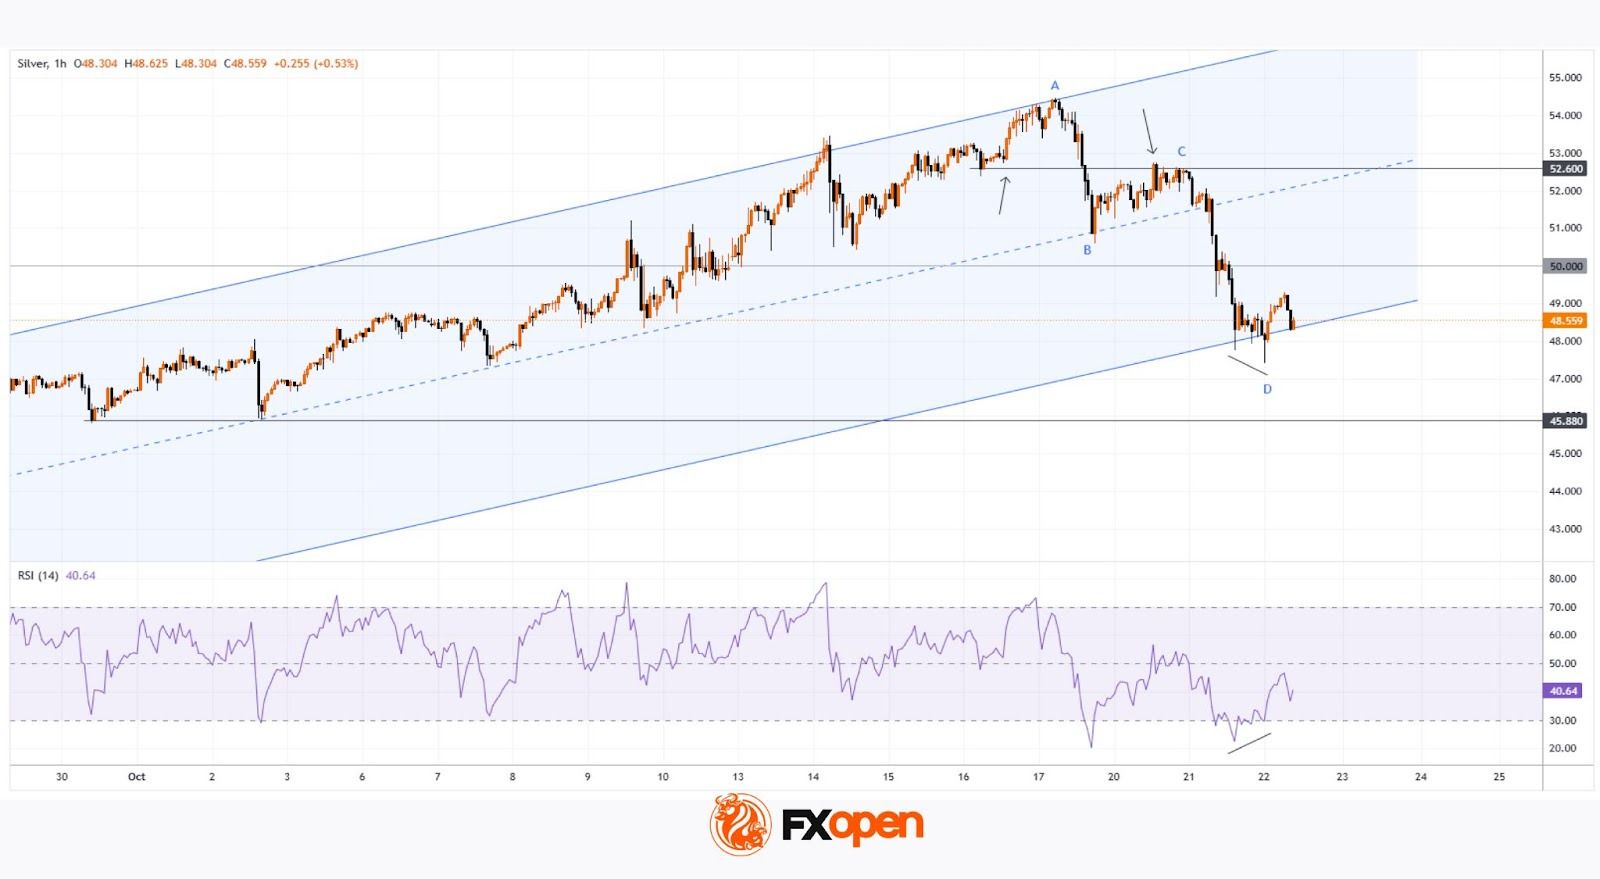
According to the XAG/USD chart, silver has fallen below the $50 mark after setting a historic high on 17 October, when the price briefly climbed above $54.40 for the first time.
Since then, the market has turned lower:
→ Silver formed a bearish ABCD pattern and broke below the key $50 psychological level.
→ A similar move occurred in gold, which dropped this week from around $4,375 to nearly $4,000 per ounce.
As many media outlets have noted:
→ The decline in precious metals appears to be a correction within a broader uptrend;
→ The fundamental outlook remains strong.
However, the aggressive nature of the sell-off raises concern.
→ On one hand, the drop may have been driven by an overheated rally and heavily leveraged long positions.
→ On the other, the speed of the decline suggests the autumn metals rally could be nearing exhaustion.
Technical Analysis of the XAG/USD Chart
An analysis of XAG/USD reveals several key turning points, allowing the construction of a widened ascending channel. This week’s drop has stretched the channel downward, effectively turning the former lower boundary into the new median line.
Bullish perspective:
→ The new lower boundary of the expanded channel acts as strong support.
→ A bullish RSI divergence has formed.
→ Price action near point D this morning resembles a potential Triple Bottom pattern.
Bearish perspective:
→ Selling pressure this week has been highly effective, with bears managing to break through:
$52.60, which has now flipped from support to resistance;
The $50 psychological level.
Given the above, it is reasonable to assume that bulls may attempt to use the lower boundary of the expanded channel to restart the autumn uptrend. However, after such a sharp sell-off, confidence may remain fragile. Should $50 now act as resistance, bears could target the next support near $45.88.
Start trading commodity CFDs with tight spreads (additional fees may apply). Open your trading account now or learn more about trading commodity CFDs with FXOpen.
This article represents the opinion of the Companies operating under the FXOpen brand only. It is not to be construed as an offer, solicitation, or recommendation with respect to products and services provided by the Companies operating under the FXOpen brand, nor is it to be considered financial advice.
Stay ahead of the market!
Subscribe now to our mailing list and receive the latest market news and insights delivered directly to your inbox.


Latest articles

CAD/JPY: The Yen's Most Historic Move in 30 Years Meets a Fragile Support
Two central banks are heading in genuinely opposite directions this week, and the tension is unmistakable. The Bank of Canada held rates steady at 2.25% on September 2, with a mildly hawkish tilt as policymakers acknowledged a broadening economic

USD/JPY and USD/CAD Await Key Fed Decision
The US dollar is consolidating against the yen and Canadian dollar ahead of the key event of the week — the Federal Reserve meeting. The Fed is widely expected to raise its policy rate by 25 basis points to a range

UnitedHealth: Fundamentals Are Healing, Now the Chart Must Agree
UnitedHealth finds itself in a genuinely split narrative right now, trading near $388, down about 15.9% from its 52-week high, even as the fundamental picture keeps improving. Q2 earnings beat expectations, with revenue of $112.03 billion, and the