


Silver Price Surpasses $80 for the First Time. Why Could This Be a Bearish Sign?
FXOpen

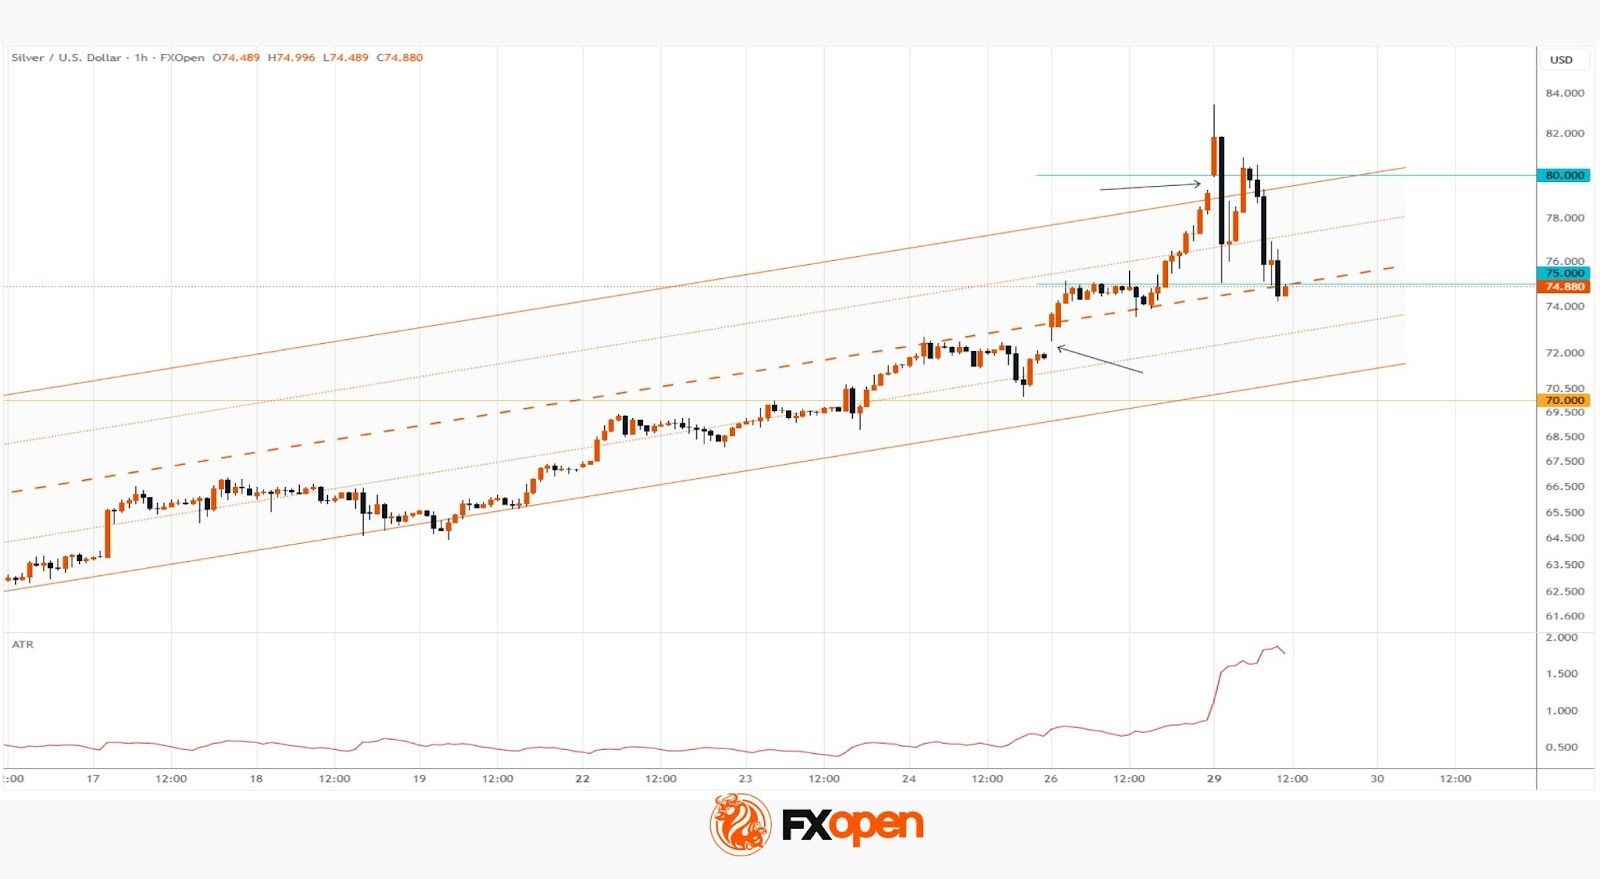
As the XAG/USD chart shows, earlier this morning the price of one ounce of silver reached above $83 for the first time. However, this move was followed by an abnormally sharp reversal to the downside.
Why Did the Silver Price Fall?
On 24 December, we not only outlined the fundamental backdrop but also highlighted that the market was vulnerable to sharp price movements due to reduced liquidity during the holiday period.
Now, as the ATR indicator has surged sharply higher—confirming our assumption—it is worth examining the key chart details that point to emerging bearish signals.
Technical Analysis of the XAG/USD Chart
The previously constructed ascending channel (highlighted in orange) has retained its slope, while the following developments occurred:
→ The silver price surge on 26 December (marked by the arrow), with a bullish gap, doubled the ascending channel.
→ At the open of today’s trading session, the price broke above the upper boundary with another bullish gap (marked by the second arrow).
It is important to note that:
→ The sharp surge in silver prices towards a historic high may have been driven by a shortage of seller liquidity at the opening of financial markets during the final week of the year.
→ The aggressive nature of the subsequent decline towards $75 appears to be a clear sign of a shift in market sentiment.
→ Wide candlesticks indicate heightened activity from so-called “smart money”.
Taking the above into account, we can assume that large long-position holders are actively locking in profits after silver prices have risen by approximately 160% since the beginning of 2025. If this hypothesis proves correct, a break below the lower boundary of the orange ascending channel may follow, potentially leading to further downside movement as early as the first days of 2026.
Start trading commodity CFDs with tight spreads (additional fees may apply). Open your trading account now or learn more about trading commodity CFDs with FXOpen.
This article represents the opinion of the Companies operating under the FXOpen brand only. It is not to be construed as an offer, solicitation, or recommendation with respect to products and services provided by the Companies operating under the FXOpen brand, nor is it to be considered financial advice.
Stay ahead of the market!
Subscribe now to our mailing list and receive the latest market news and insights delivered directly to your inbox.


Latest articles

Nasdaq 100: 48 Hours of Chaos, One Trendline Standing in the Way
Wall Street just lived through one of its wildest 48 hours of the year. On Wednesday, the Fed held rates steady at 3.50%-3.75%, but three FOMC members broke ranks to demand a hike—an unusually hawkish dissent

Amazon Analysis: Strong Earnings Coincide with a Breakout from the Correction
On 30 July, Amazon.com reported its financial results for the second quarter of 2026, significantly exceeding market expectations. Revenue rose 20% year-on-year to $200.6 billion, compared with the consensus forecast of around $196.5 billion. The main growth

GBP/USD and EUR/GBP Await Key Bank of England Decision
The pound strengthened following the outcome of the US Federal Reserve meeting, where the central bank, as expected, kept interest rates unchanged. However, the Fed did not provide the market with clear signals of an imminent shift towards rate cuts,