


FXOpen
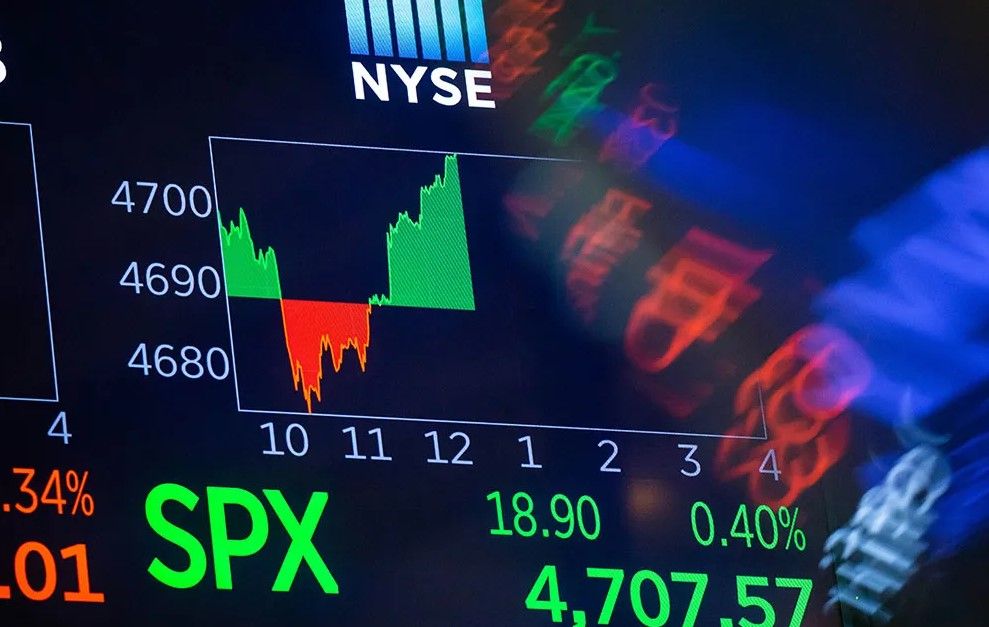
The S&P 500 fell 70.02 points, or 1.47%, to 4,698.35 yesterday, according to Dow Jones Newswires. This is the largest one-day point decline since Thursday, September 21, 2023.
Of the 500 stocks in the index, only 19 closed in the green. Of these, Google shares, as the company announced plans to reorganize its advertising department, which employs 30 thousand people.
From a fundamental perspective, there were no obvious triggers that carried enough weight to cause the sharp decline. Moreover, the Consumer Confidence indicator was published yesterday, which showed that consumer confidence has increased the most since the beginning of 2021.
From the point of view of behavioral psychology and technical analysis, the sharp decline has reasonable explanations:
→ from the low of late October to the beginning of yesterday's session, the S&P 500 index grew by 16%. This is an impressive rally, fueled by expectations of easing inflation and interest rate cuts in 2024. A significant correction is a logical development of events.
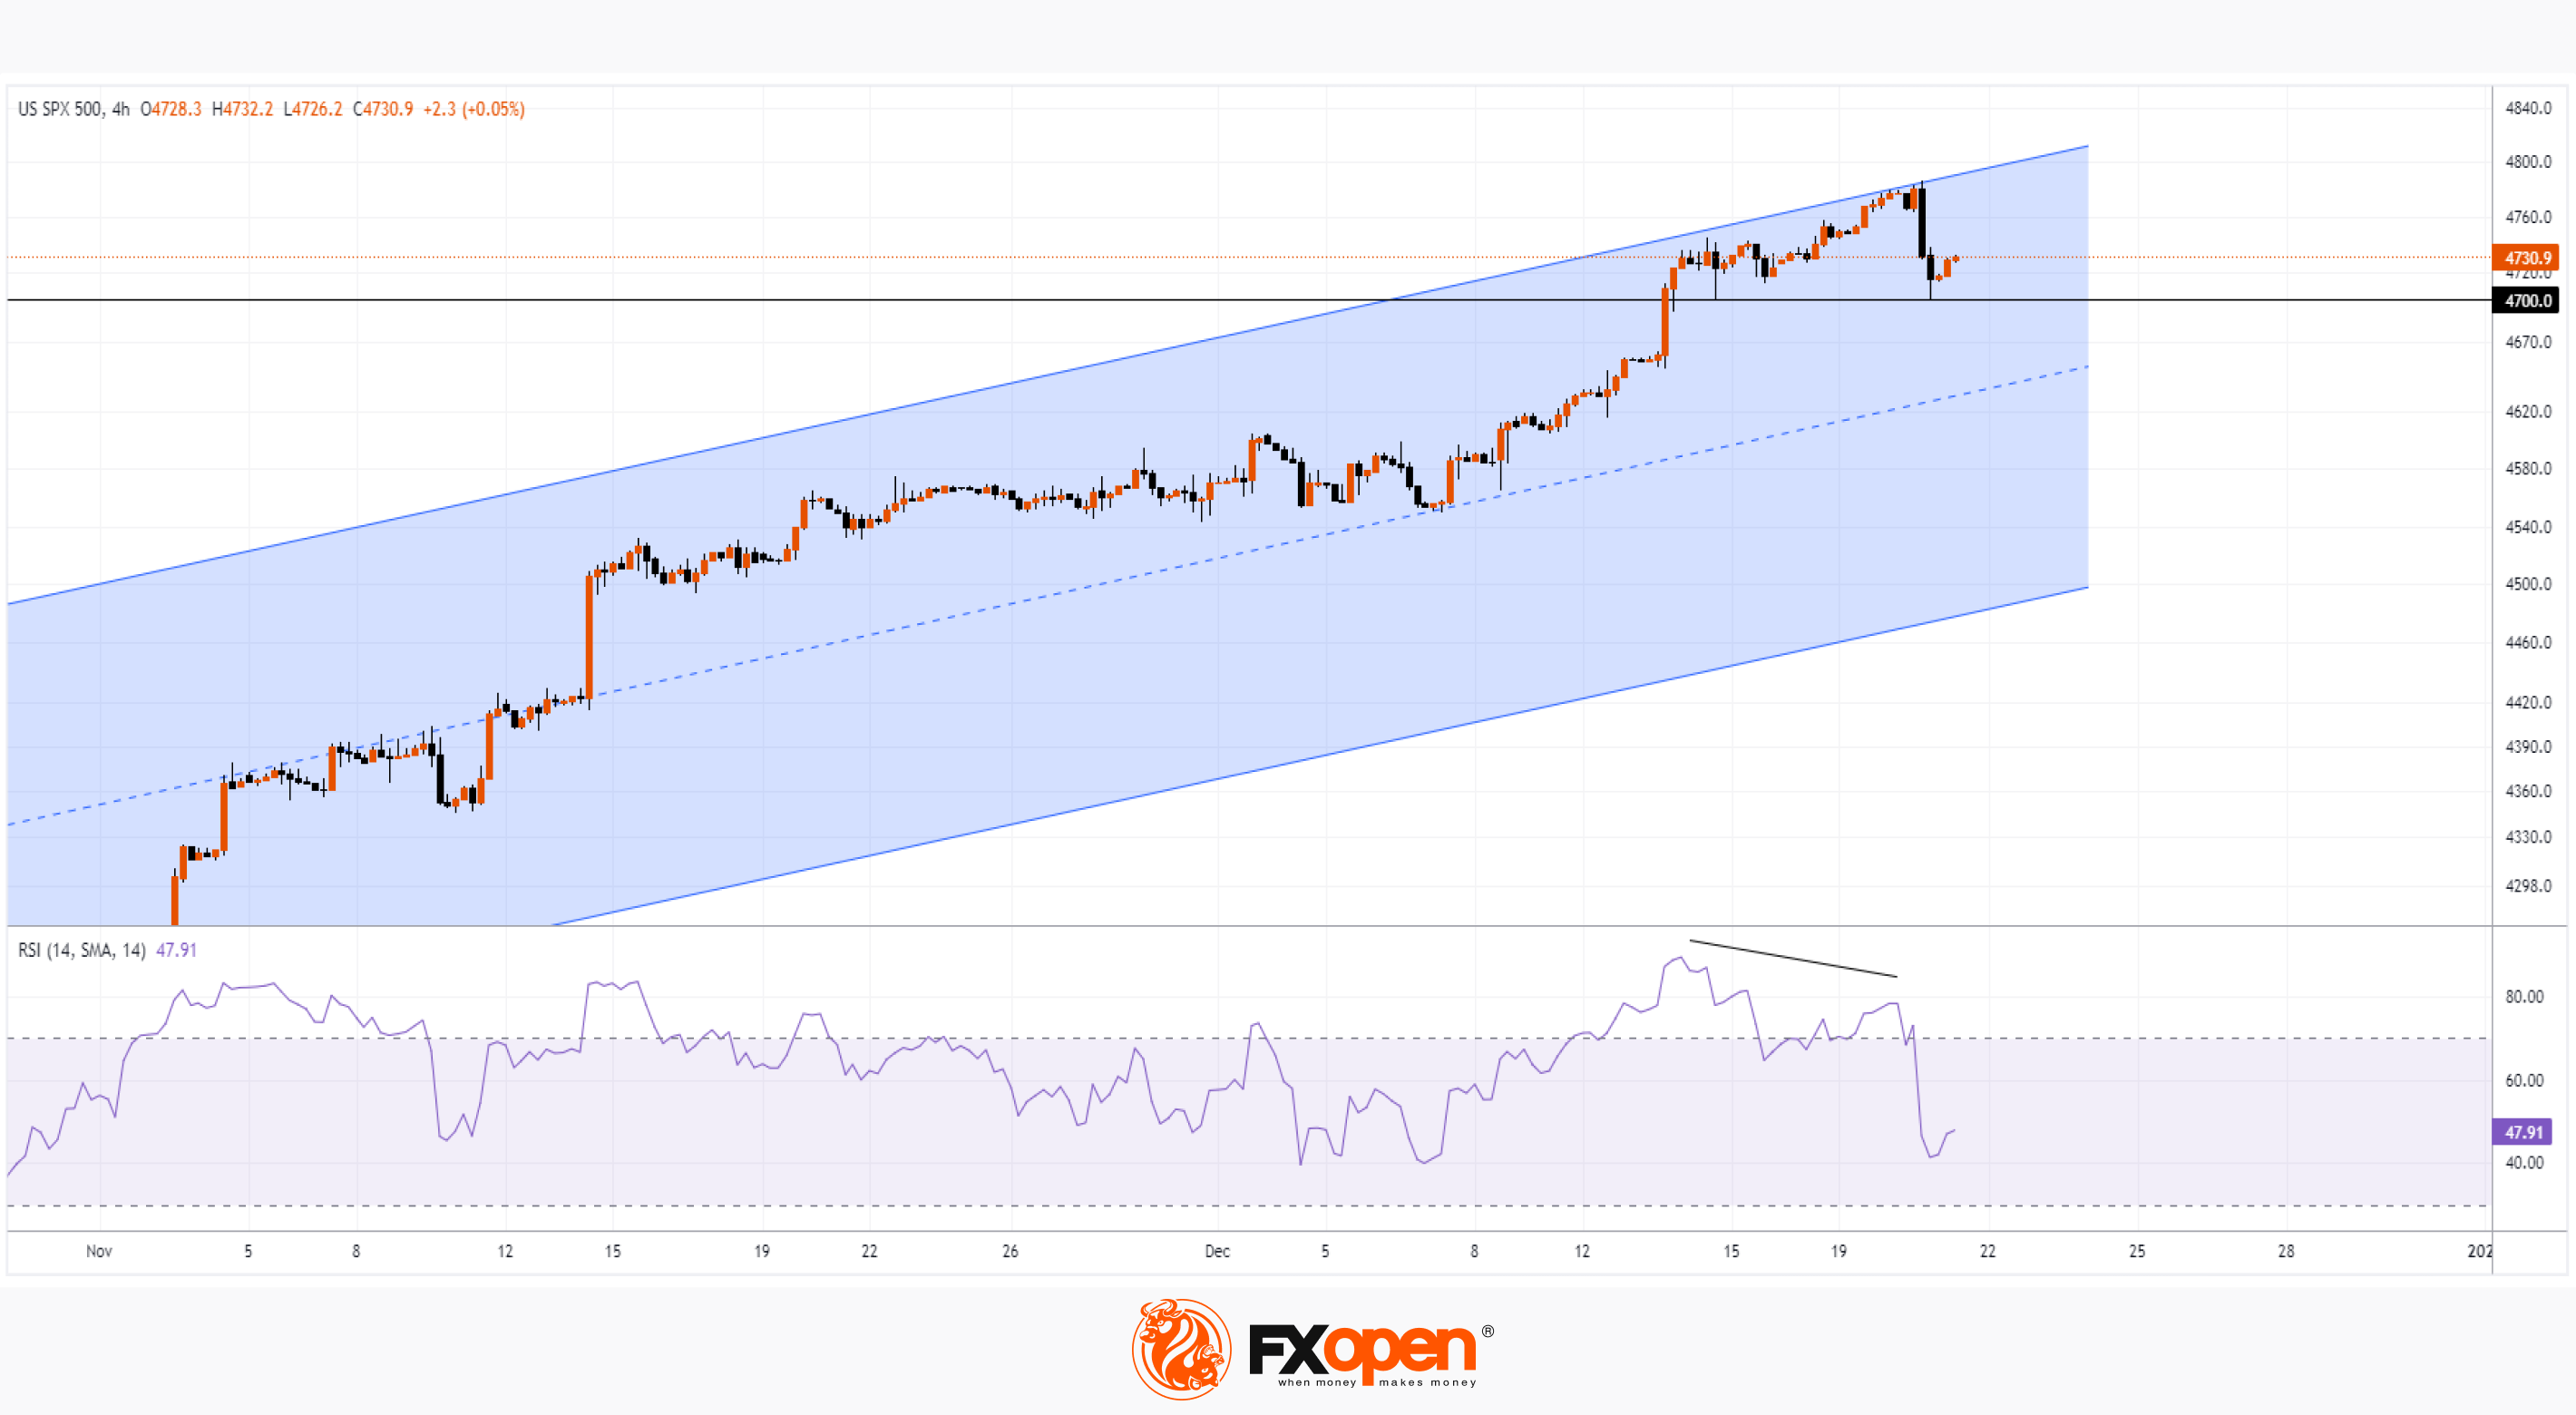
→ The market was overbought, as indicated by the RSI indicator. The indicator also pointed to divergence – a sign of weakening demand.
→ Buyers might want to lock in profits. And as yesterday's decline progressed, they could have rushed to do so, thereby accelerating the decline. It is logical to want to withdraw money and not hold positions during the holiday period.
It is important to take into account that the price of the S&P 500 was near important resistances:
→ near the historical maximum (by the way, the E-mini S&P 500 futures market exceeded the maximum);
→ near the upper border of the ascending channel (shown in blue).
Thus, the price of the S&P 500 dropped to support around 4,700. But it is possible that after yesterday’s decline, the market may receive additional bearish impulse at the opening of the American session. If the bears maintain the initiative shown yesterday, it is possible that they will be able to lower the price of the S&P 500 to the median line of the ascending channel.
Trade global index CFDs with zero commission and tight spreads (additional fees may apply). Open your FXOpen account now or learn more about trading index CFDs with FXOpen.
This article represents the opinion of the Companies operating under the FXOpen brand only. It is not to be construed as an offer, solicitation, or recommendation with respect to products and services provided by the Companies operating under the FXOpen brand, nor is it to be considered financial advice.
Stay ahead of the market!
Subscribe now to our mailing list and receive the latest market news and insights delivered directly to your inbox.


Latest articles

Consolidation Ahead of NFP: Commodity Currencies Search for Direction
Commodity-linked currencies have entered a consolidation phase following recent directional moves, as market participants adopt a wait-and-see approach ahead of key US labour market data. Current price action reflects a balance between ongoing demand for the US dollar and attempts

The Real Driver Behind the Dollar Rally: Market Insights with Gary Thomson
The US dollar has been firm, but the drivers behind the move may be more complex than they first appear.
While geopolitical tension and shifts in risk sentiment play a role, current price behaviour seems increasingly influenced by inflation expectations

EUR/USD and USD/CHF Pull Back: Market Reacts to Fundamentals
European currencies have shown a recovery in recent trading sessions after their recent decline, displaying early signs of a reversal. The US dollar is weakening amid expectations surrounding upcoming US macroeconomic data, while market participants are reassessing their short-term positions