


Spring Results: NASDAQ 100 Overtakes Bitcoin
FXOpen

This is how prices for popular exchange-traded assets changed from March 1 to May 31:
→ The price of the NASDAQ 100 increased by almost 20%
→ The price of the S&P-500 increased by almost 6%
→ The price of gold increased by almost 7%
→ The price of bitcoin increased by almost 14%
→ The price of Ethereum increased by almost 12%
For a long time, cryptocurrencies were the leaders of the spring market, but in May, the NASDAQ-100 made a sharp leap upwards, thanks to the soaring of the NVDA share price and the hype around artificial intelligence (AI).
What will happen in summer?
According to Citigroup analysts, there is a risk that the rally in US technology stocks will end as investors want to take profits.
Perhaps the hype around AI will decrease, as its widespread adoption should take time. Barclays analysts note that past game-changing technologies took several decades to show up at the level of the entire economy. Take electricity, automobiles, and refrigeration, for example – US labor productivity skyrocketed in the 1950s, 3-4 decades after these technologies were introduced.
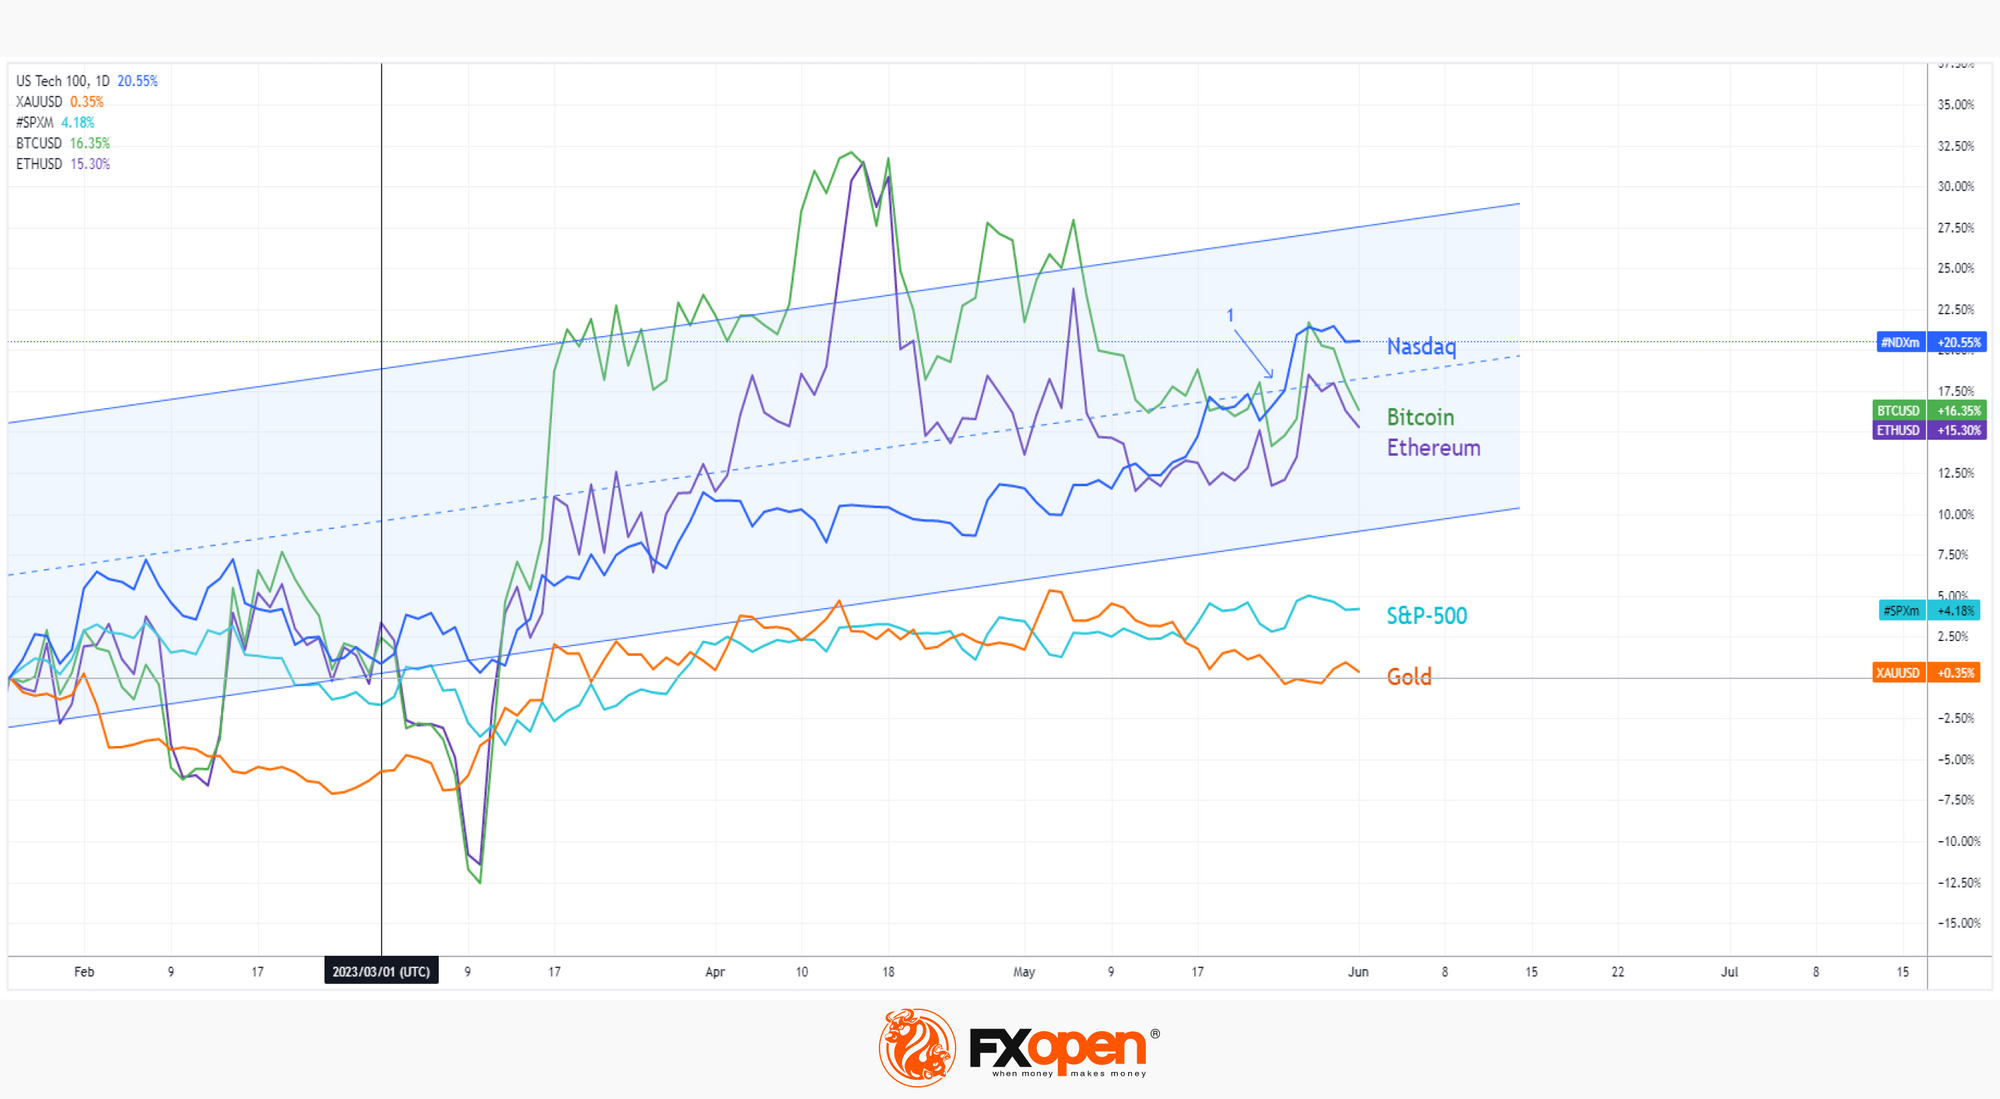
However, the NASDAQ-100 chart looks bullish. The price has broken (1) up the median line of the ascending channel (shown in blue) and, from the point of view of the technical analysis of the NASDAQ 100, it is now worth focusing on a possible test of this breakdown. If it happens with a strong rebound, it will be a sign of a strong market. If the test happens and no strong bullish patterns follow, it will be a bearish threat to the NASDAQ 100 price.
Trade global index CFDs with zero commission and tight spreads (additional fees may apply). Open your FXOpen account now or learn more about trading index CFDs with FXOpen.
This article represents the opinion of the Companies operating under the FXOpen brand only. It is not to be construed as an offer, solicitation, or recommendation with respect to products and services provided by the Companies operating under the FXOpen brand, nor is it to be considered financial advice.
Stay ahead of the market!
Subscribe now to our mailing list and receive the latest market news and insights delivered directly to your inbox.


Latest articles

AUD/CAD: Months of Indecision — Is a Breakout Finally Coming?
The Australian dollar has clawed back most of its end-of-June losses, when it touched three-month lows against the greenback amid escalating Middle East tensions. Since then, sentiment has improved: the RBA's Assistant Governor Sarah Hunter signalled the board stands ready

USD/JPY: Battling at the Top of the Triangle
On 3 July, Japan's Finance Minister, Satsuki Katayama, stated that the Ministry of Finance remains in close contact with US authorities regarding developments in USD/JPY as the yen traded near its weakest level in almost 40 years. Similar verbal

Dow Jones (DJIA): Consolidation Beyond the Trend
Federal Reserve Chair Kevin Warsh testified before Congress on 14–15 July, reaffirming the Fed's commitment to bringing inflation back to target while providing no clear guidance on the future path of interest rates. Meanwhile, June inflation data came in