


Tesla (TSLA) Shares Surge by 11%
FXOpen

As shown by Tesla's stock chart, trading closed below $213.50 yesterday. However, following the main trading session, the company reported its third-quarter earnings:
→ Earnings per share (EPS): actual = $0.72, expected = $0.59
→ Gross revenue: actual = $25.46 billion, expected = $25.18 billion
Additionally, Tesla forecasted a sharp increase in vehicle sales, assuring investors that CEO Elon Musk remains focused on expanding the company's core electric vehicle business.
According to Reuters, this earnings report positively impacted investors who were previously concerned about:
→ Profit margins shrinking due to price cuts.
→ Musk potentially being distracted by new projects like the Cybercab robotaxi, Robovan, and humanoid robots (Optimus Gen), which were unveiled during the "We, Robot" event that caused a TSLA stock drop on October 11.
As a result, Tesla's pre-market share price shows a rise of over 11%, indicating that today's trading may open around $235.
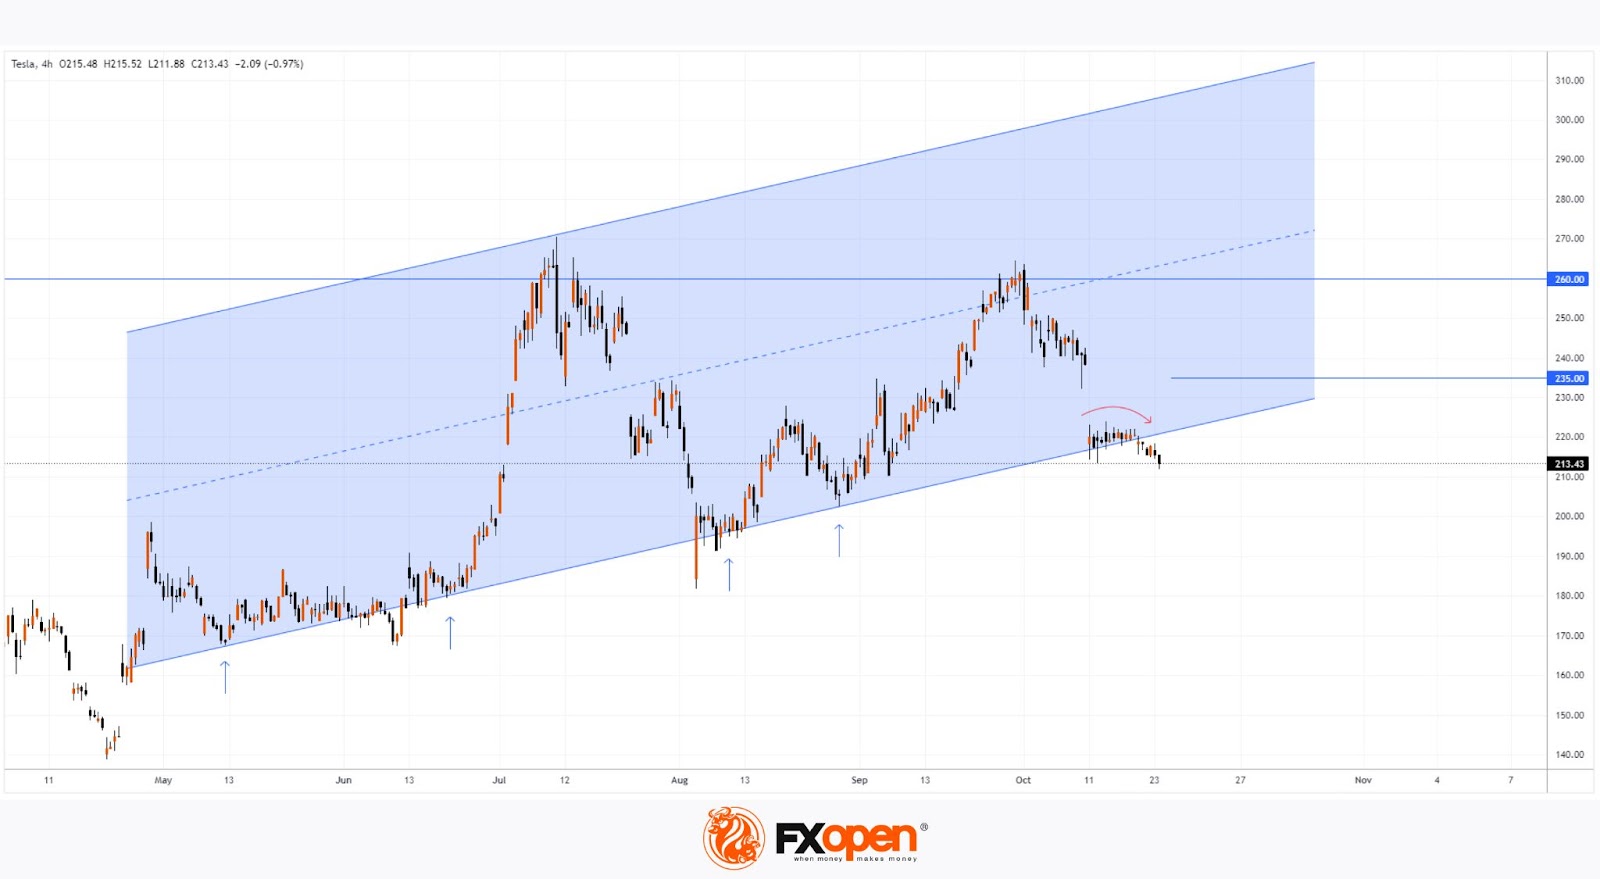
The technical analysis of Tesla's (TSLA) stock chart provides crucial insights into the stock's recent bullish momentum:
→ Since May, Tesla's stock has moved within an upward channel (shown in blue), with the lower boundary acting as significant support (indicated by blue arrows).
→ The downward rounding in October (shown by the red arrow) may signal bearish pressure aimed at testing this support.
The bullish momentum following the earnings report suggests that the attempt to break below the channel's lower boundary failed. Therefore, bulls may continue to push TSLA's price upwards within the existing channel. It's possible we could see another attempt to challenge the key resistance level at $260 by the end of the year.
Buy and sell stocks of the world's biggest publicly-listed companies with CFDs on FXOpen’s trading platform. Open your FXOpen account now or learn more about trading share CFDs with FXOpen.
This article represents the opinion of the Companies operating under the FXOpen brand only. It is not to be construed as an offer, solicitation, or recommendation with respect to products and services provided by the Companies operating under the FXOpen brand, nor is it to be considered financial advice.
Stay ahead of the market!
Subscribe now to our mailing list and receive the latest market news and insights delivered directly to your inbox.


Latest articles

AUD/CAD: Months of Indecision — Is a Breakout Finally Coming?
The Australian dollar has clawed back most of its end-of-June losses, when it touched three-month lows against the greenback amid escalating Middle East tensions. Since then, sentiment has improved: the RBA's Assistant Governor Sarah Hunter signalled the board stands ready

USD/JPY: Battling at the Top of the Triangle
On 3 July, Japan's Finance Minister, Satsuki Katayama, stated that the Ministry of Finance remains in close contact with US authorities regarding developments in USD/JPY as the yen traded near its weakest level in almost 40 years. Similar verbal

Dow Jones (DJIA): Consolidation Beyond the Trend
Federal Reserve Chair Kevin Warsh testified before Congress on 14–15 July, reaffirming the Fed's commitment to bringing inflation back to target while providing no clear guidance on the future path of interest rates. Meanwhile, June inflation data came in