


The Hang Seng Index is Near Important Support
FXOpen
The economy of China is hit by the decision to liquidate the developer Evergrande due to a debt of USD 300 billion. Bloomberg writes that this will have huge consequences for all of China.
While the S&P 500 index rose by more than 3% since the beginning of January, the Hang Seng index fell by more than 8%. JPMorgan and HSBC point to local government debt, non-performing bank loans and negative sentiment in the private sector.
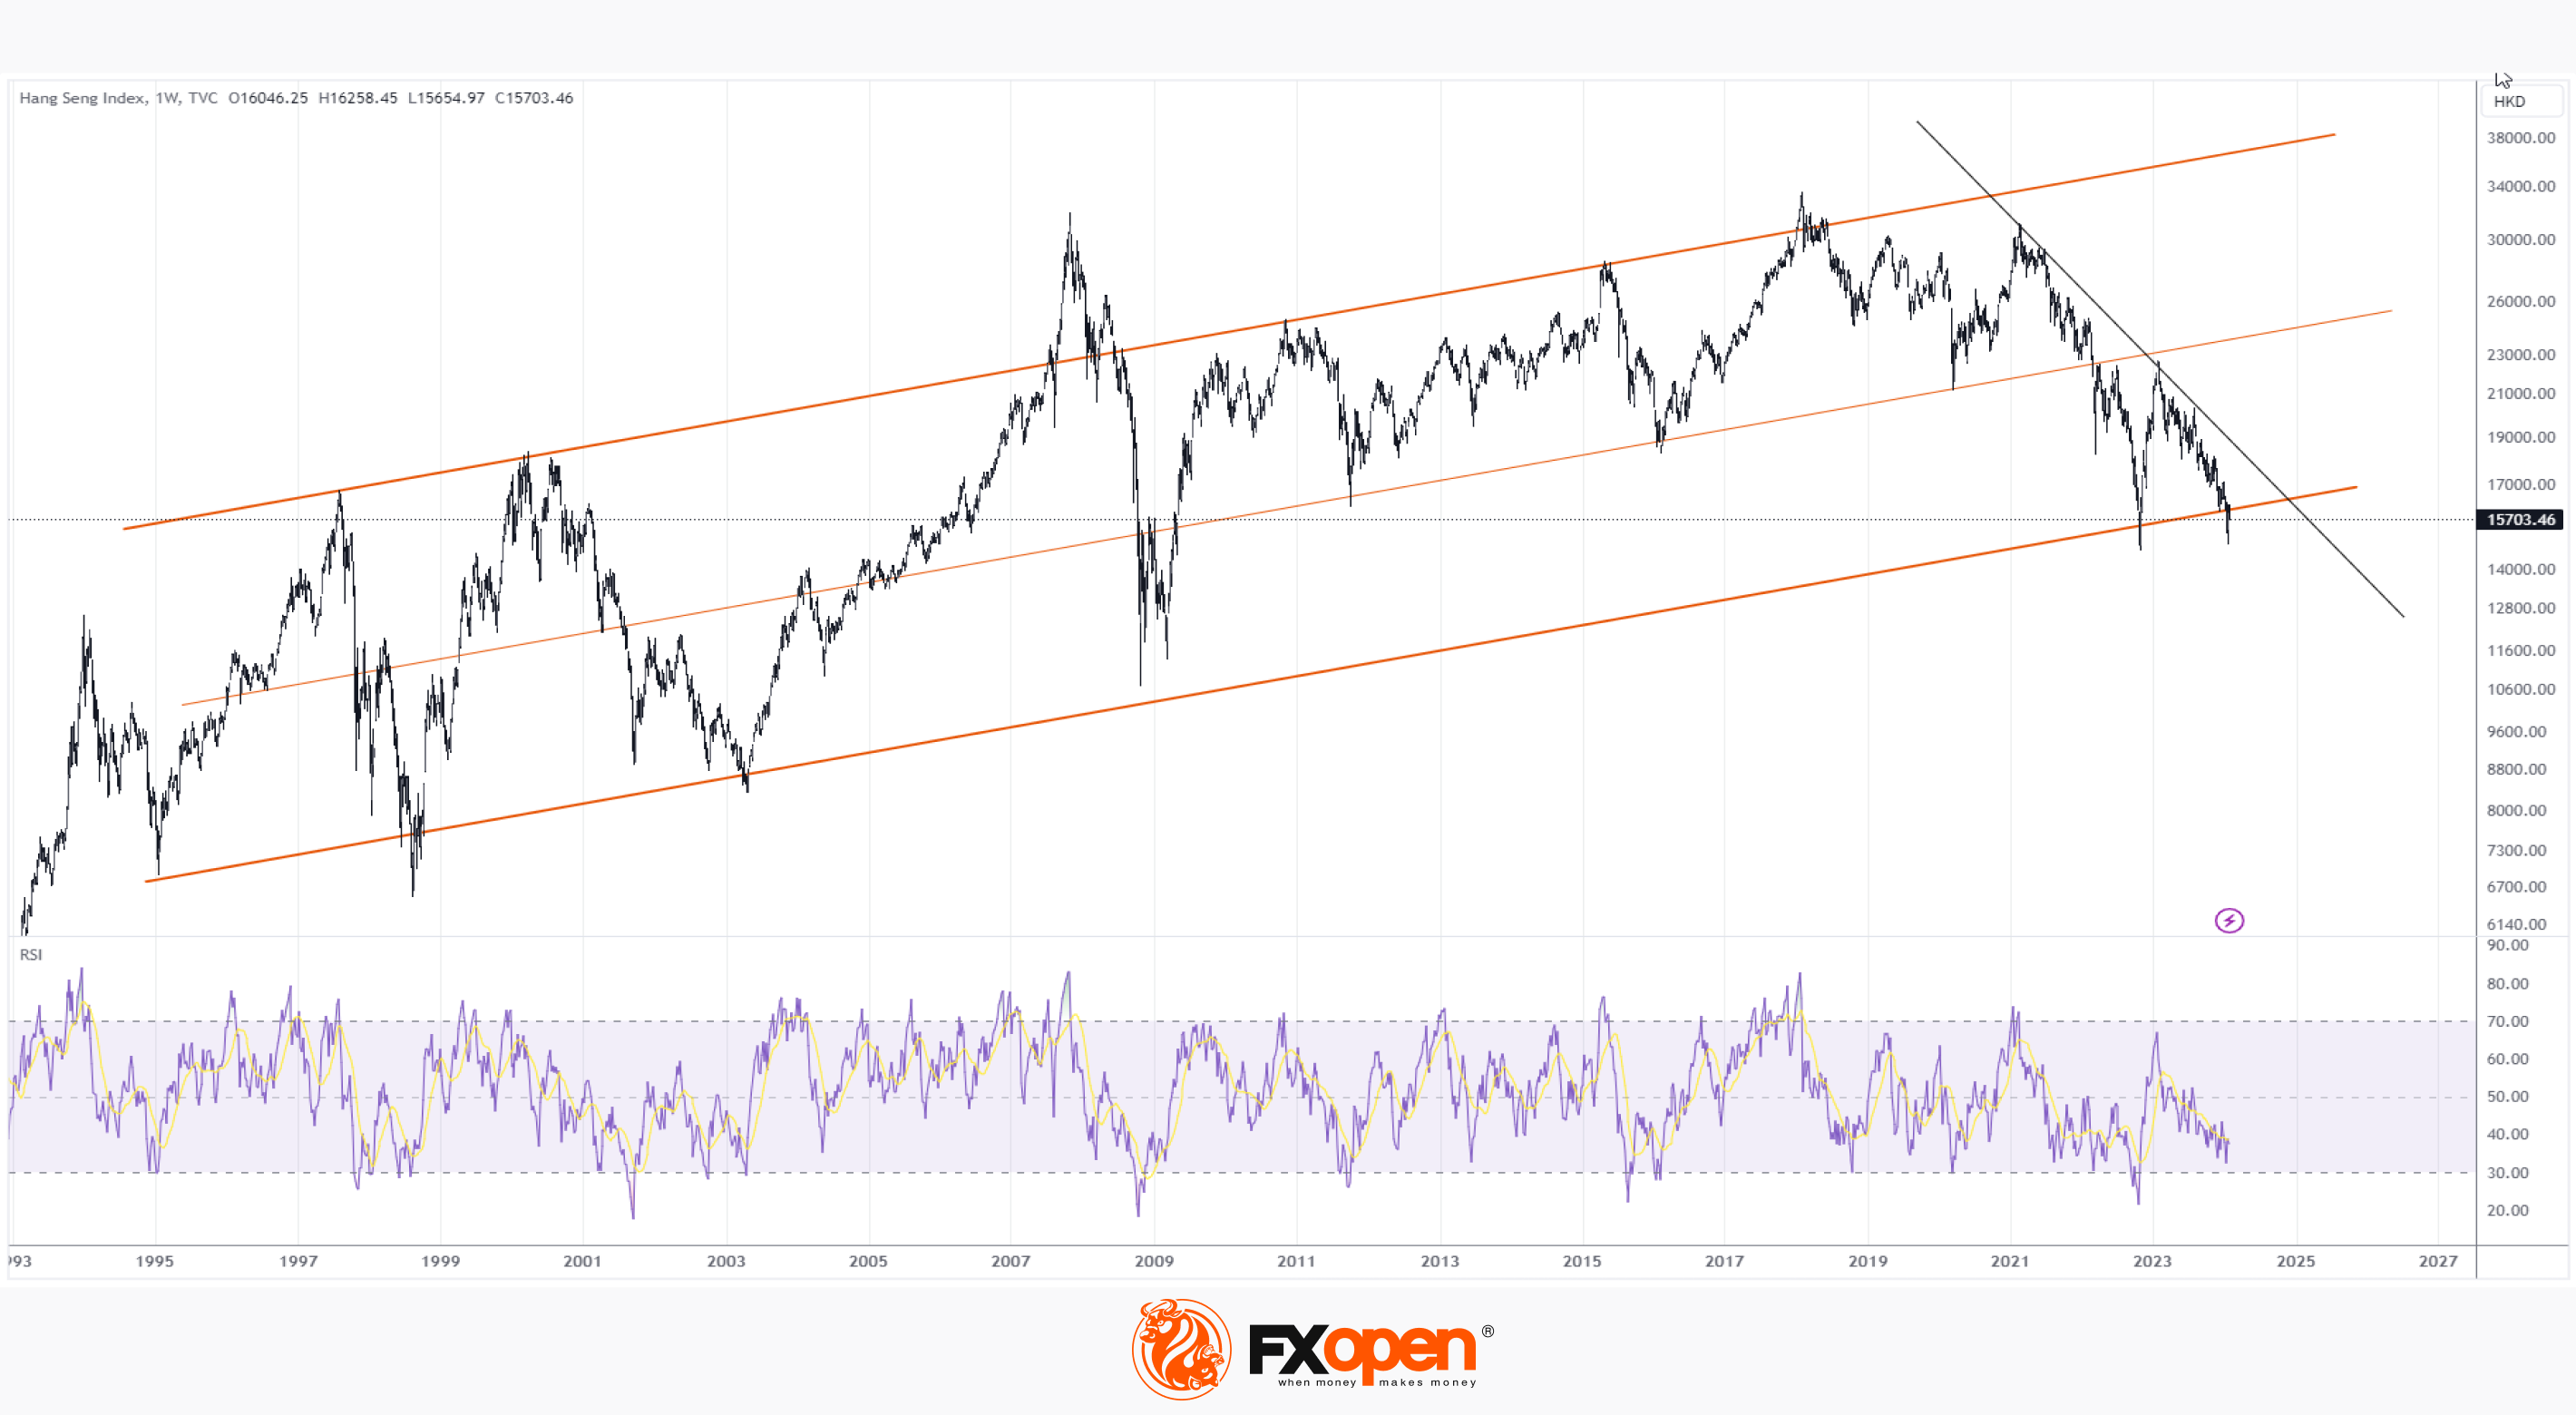
The weekly chart of the stock index Hang Seng (HSI) shows that:
→ The price is in a downward trend, which is shown by the black line.
→ The price dropped close to the 2022 minimum.
→ The RSI indicator is located near the oversold zone.
What is important: the price is near the lower border of the long-term channel (shown by orange lines), from which support can be expected.
Expectations of investors to lower the interest rate from the Fed may increase the appetite for risky assets, which features Chinese stocks.
As Reuters writes, Goldman Sachs noted in its note to clients that hedge funds are actively buying Chinese shares - for the period from January 23 to 25, there was the largest capital inflow in the last 5 years. Perhaps the managers of hedge funds believe that the plans of the Chinese authorities to stimulate the economy for more than $280 billion will become a reality, and the price of the Hang Seng index will make a jump from the lower border of the long-term channel, breaking the black line of the downward trend.
Trade global index CFDs with zero commission and tight spreads (additional fees may apply). Open your FXOpen account now or learn more about trading index CFDs with FXOpen.
This article represents the opinion of the Companies operating under the FXOpen brand only. It is not to be construed as an offer, solicitation, or recommendation with respect to products and services provided by the Companies operating under the FXOpen brand, nor is it to be considered financial advice.
Stay ahead of the market!
Subscribe now to our mailing list and receive the latest market news and insights delivered directly to your inbox.


Latest articles

AI Valuations Are Back in the Spotlight
Artificial intelligence remains the dominant investment theme of 2026, but investors are increasingly questioning whether AI stock valuations are keeping pace with reality.
💰 Big Tech continues to invest at an unprecedented scale, with hyperscaler AI spending projected to exceed $800

AUD/CAD: Months of Indecision — Is a Breakout Finally Coming?
The Australian dollar has clawed back most of its end-of-June losses, when it touched three-month lows against the greenback amid escalating Middle East tensions. Since then, sentiment has improved: the RBA's Assistant Governor Sarah Hunter signalled the board stands ready

USD/JPY: Battling at the Top of the Triangle
On 3 July, Japan's Finance Minister, Satsuki Katayama, stated that the Ministry of Finance remains in close contact with US authorities regarding developments in USD/JPY as the yen traded near its weakest level in almost 40 years. Similar verbal