


FXOpen

As we wrote on June 17th, analyzing the Nikkei 225 chart (Japan 225 on FXOpen):
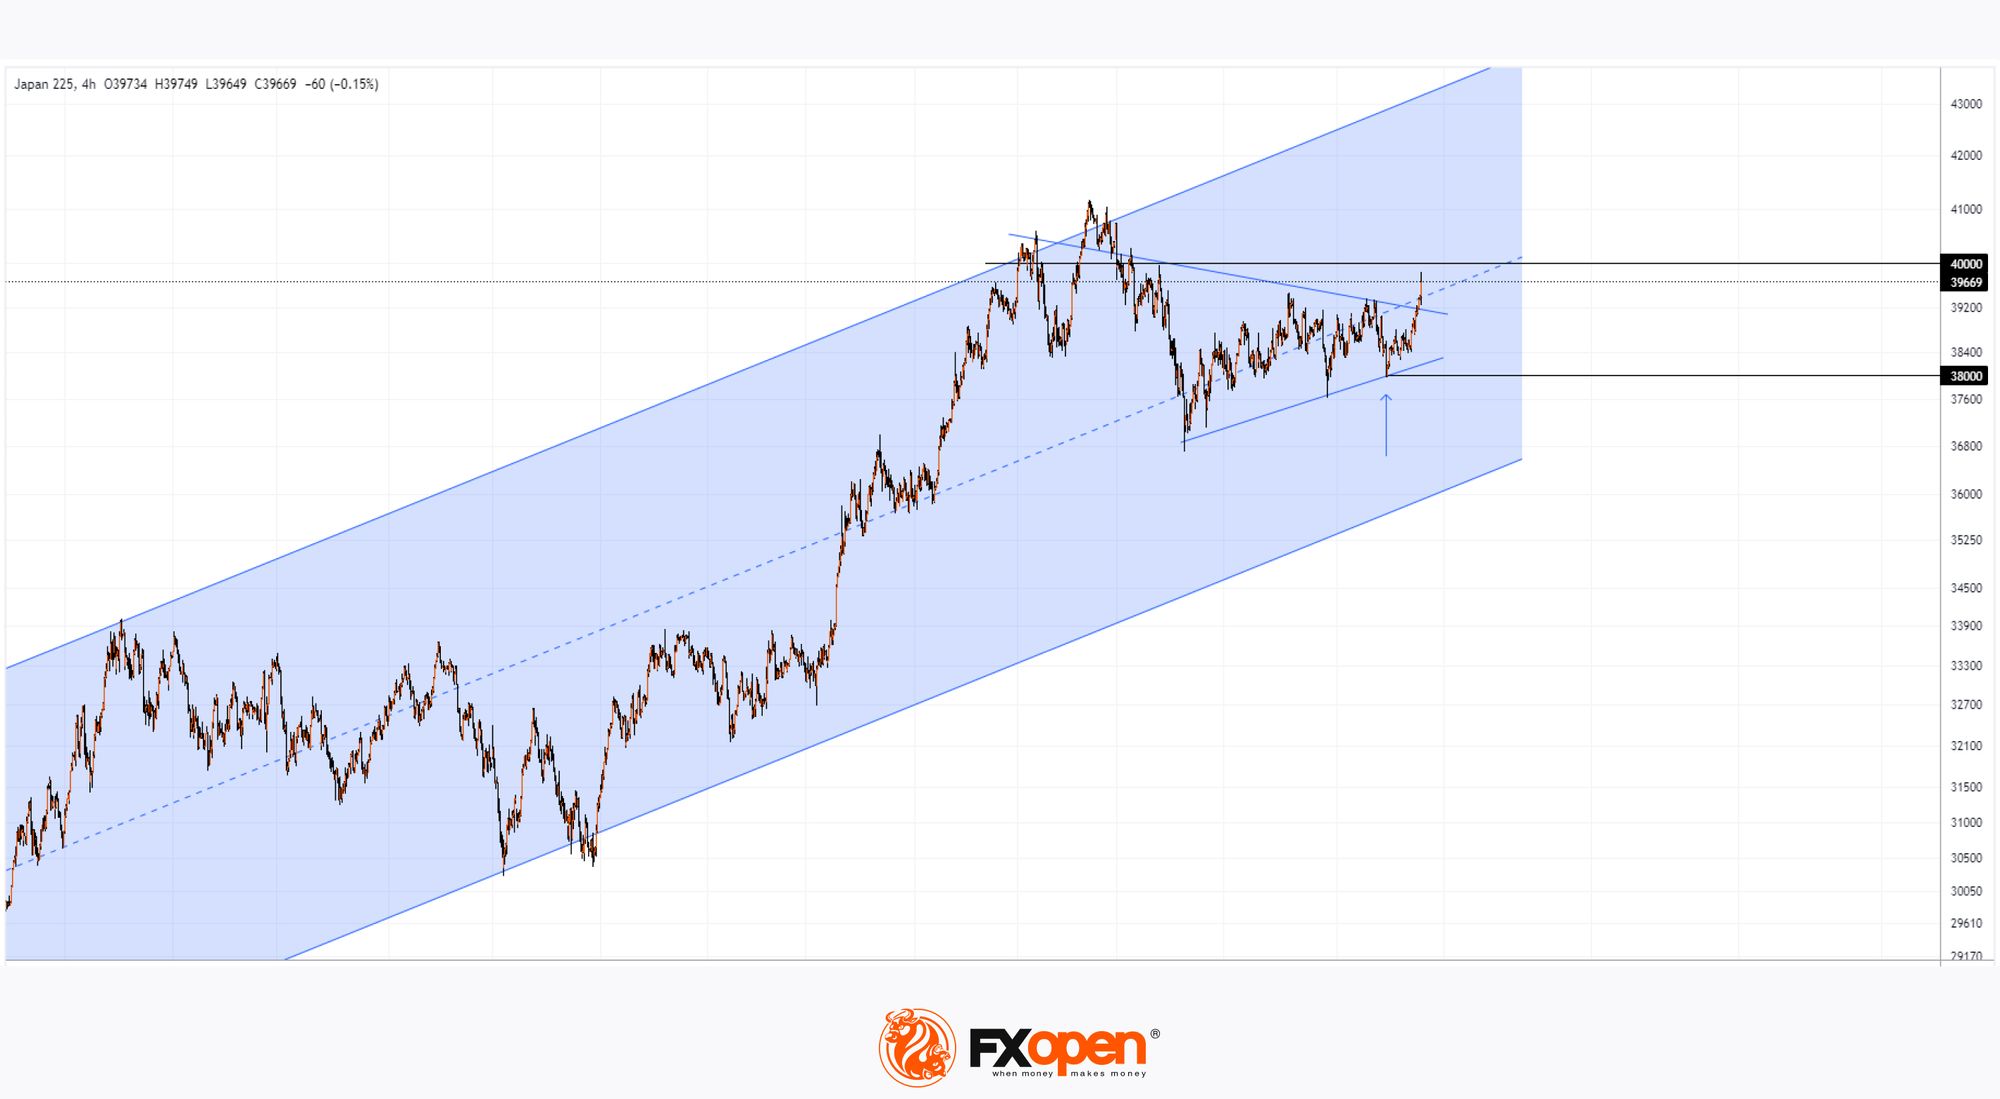
→ the price formed a consolidation pattern (in the shape of a narrowing triangle);
→ the price formed a bullish reversal from the 38,000 points level (indicated by an arrow), suggesting potential growth and trend establishment upon pattern breakout.
Since then, the price has broken out of the consolidation triangle and today exceeded the 39,800 level - marking the highest point since mid-April.
Technical analysis of the Nikkei 225 chart (Japan 225 on FXOpen) provides more information:
→ the price is in a significant uptrend (shown by the blue channel);
→ after breaking out of the consolidation triangle, the price reached the median line of the channel - implying that the bullish momentum may weaken here, but not necessarily come to an end completely.
It is possible that the Nikkei 225 index (Japan 225 on FXOpen) will continue to rise steadily along the median line, but fundamental factors should be considered as key drivers:
Firstly, the ultra-loose policy of the Bank of Japan, which is beneficial for the growth of Japan's export-oriented enterprises. However, the central bank's policy is increasingly criticized, especially with the USD/JPY exchange rate nearing the 'red line' of 160 yen per dollar.
Secondly, the influence of the US stock market. In this regard, it should be noted that:
→ the current rise in the Nikkei 225 index (Japan 225 on FXOpen) is linked to the strong recovery of NVDA shares after three days of decline;
→ upcoming news on US inflation. The Personal Consumption Expenditures (PCE) index values will be published on Friday at 15:30 GMT+3 and could cause significant volatility in financial markets, potentially affecting the price of the Nikkei 225 index (Japan 225 on FXOpen).
A significant resistance level is seen at the psychological level of 40,000. After the price surpassed it in March (but failed to hold above it on two attempts), it retraced by more than 9% with the formation of the aforementioned consolidation triangle.
Trade global index CFDs with zero commission and tight spreads (additional fees may apply). Open your FXOpen account now or learn more about trading index CFDs with FXOpen.
This article represents the opinion of the Companies operating under the FXOpen brand only. It is not to be construed as an offer, solicitation, or recommendation with respect to products and services provided by the Companies operating under the FXOpen brand, nor is it to be considered financial advice.
Stay ahead of the market!
Subscribe now to our mailing list and receive the latest market news and insights delivered directly to your inbox.


Latest articles

Consolidation Ahead of NFP: Commodity Currencies Search for Direction
Commodity-linked currencies have entered a consolidation phase following recent directional moves, as market participants adopt a wait-and-see approach ahead of key US labour market data. Current price action reflects a balance between ongoing demand for the US dollar and attempts

The Real Driver Behind the Dollar Rally: Market Insights with Gary Thomson
The US dollar has been firm, but the drivers behind the move may be more complex than they first appear.
While geopolitical tension and shifts in risk sentiment play a role, current price behaviour seems increasingly influenced by inflation expectations

EUR/USD and USD/CHF Pull Back: Market Reacts to Fundamentals
European currencies have shown a recovery in recent trading sessions after their recent decline, displaying early signs of a reversal. The US dollar is weakening amid expectations surrounding upcoming US macroeconomic data, while market participants are reassessing their short-term positions