


The Price of Gold Continues to Hit Record Highs
FXOpen

As shown by today's XAU/USD chart, the price of an ounce of gold is around $2,628, marking a new all-time high for three consecutive trading days: 20th, 23rd, and 24th September.
The bullish sentiment in the gold market is driven by:
→ the reaction to Wednesday’s decision by the Federal Reserve to cut interest rates by 50 basis points;
→ another surge in tensions in the Middle East.
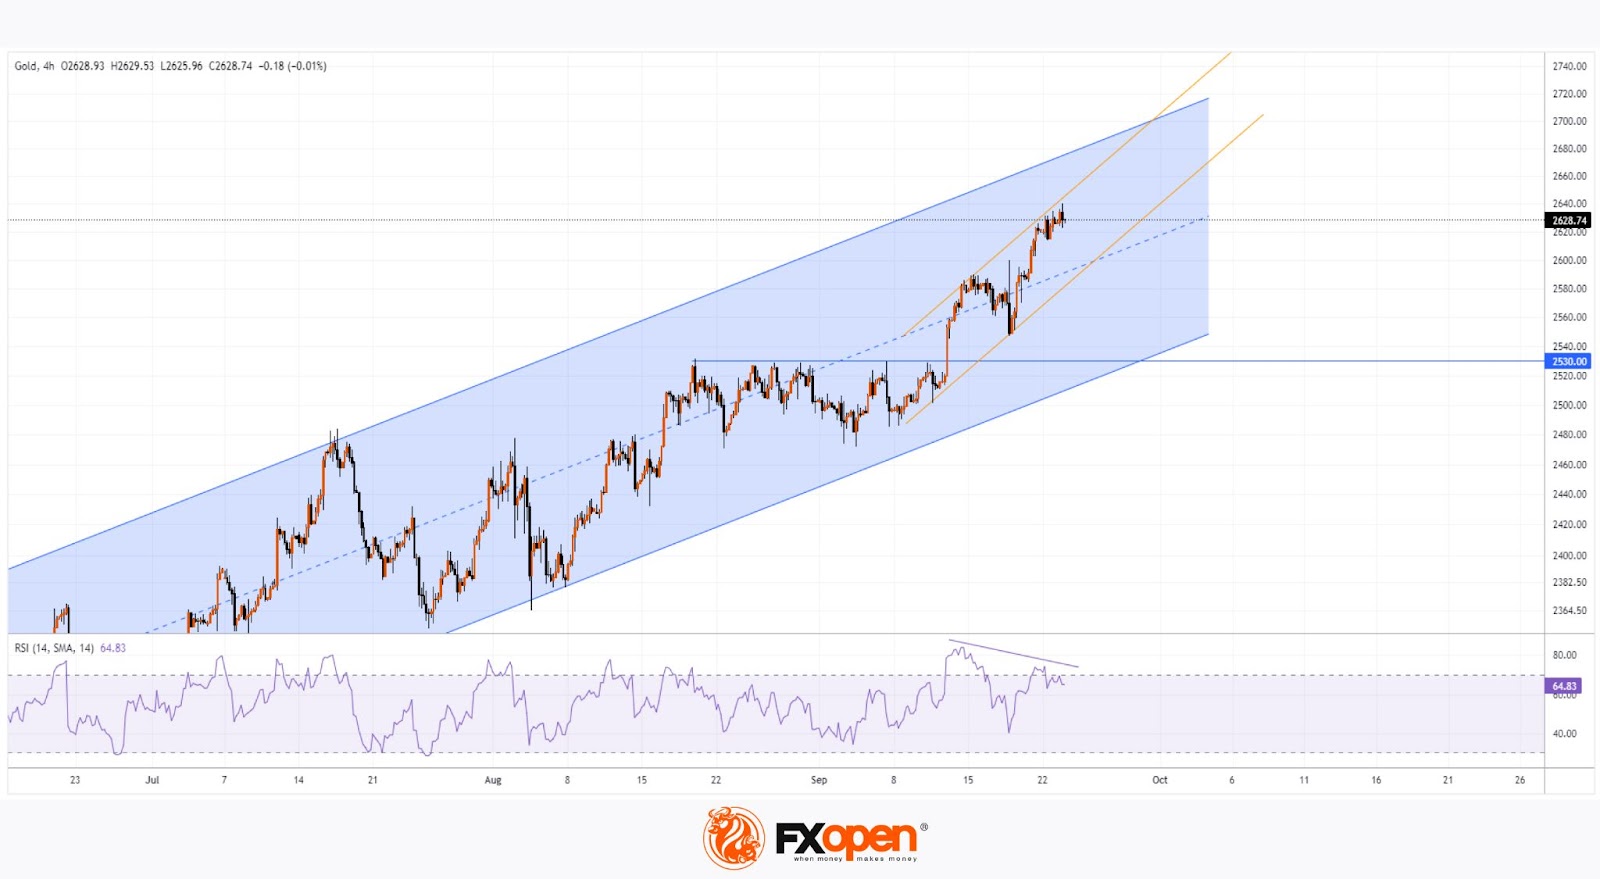
Technical analysis of the XAU/USD chart shows gold’s price is moving within an upward channel (marked in blue), with the bullish momentum becoming more pronounced in September. Since the beginning of the month, bulls have managed to:
→ break through the resistance level of $2,530;
→ lift the price into the upper half of the blue channel;
→ establish a steeper upward trajectory (shown by yellow lines).
However, it’s worth noting that:
→ each new record high is only slightly above the previous one;
→ the RSI indicator is forming a divergence.
This suggests that the bullish momentum may be weakening. It’s possible that market participants may look to take profits from long positions, leaving the price vulnerable to a pullback, potentially towards the lower boundary of the yellow channel, which is reinforced by the blue median line.
Start trading commodity CFDs with tight spreads (additional fees may apply). Open your trading account now or learn more about trading commodity CFDs with FXOpen.
This article represents the opinion of the Companies operating under the FXOpen brand only. It is not to be construed as an offer, solicitation, or recommendation with respect to products and services provided by the Companies operating under the FXOpen brand, nor is it to be considered financial advice.
Stay ahead of the market!
Subscribe now to our mailing list and receive the latest market news and insights delivered directly to your inbox.


Latest articles

USD/CAD: One Trendline Away From Deciding the Next Move
After several strongly positive weeks, USD/CAD has stalled over the past few sessions, entering a phase of uncertainty.
On the dollar side, Fed Chair Kevin Warsh has struck a firm tone, reaffirming the 2% inflation target and pushing back

Amazon: New Bond Issuance to Fund AI Infrastructure
On 7 July, Amazon announced an eight-tranche bond offering worth at least $25 billion, with the proceeds expected to finance the construction of data centres and the expansion of its artificial intelligence infrastructure. Investor demand peaked at $62 billion, highlighting

Weekly Market Insights with Gary Thomson: US Inflation, UK GDP, Chair Warsh Testimony, and Earnings
In this video, we’ll explore the key economic events and market trends, shaping the financial landscape. Get ready for insights into financial markets to help you navigate the week ahead. Let’s dive in!
In this episode of Market