


FXOpen

As the Tesla (TSLA) stock chart shows today, the price increased by more than 7% during yesterday's trading, surpassing the $240 mark.
The bullish sentiment was supported by the following factors:
→ The Federal Reserve's decision to cut interest rates by 0.5%;
→ Data tracked by Citi analyst Jeff Chung. According to Barron’s, they indicated that Tesla sold more than 15,000 vehicles in China last week – strong sales there could help the company deliver one of its best quarters.
→ A key signal from the technical analysis of the Tesla (TSLA) chart.
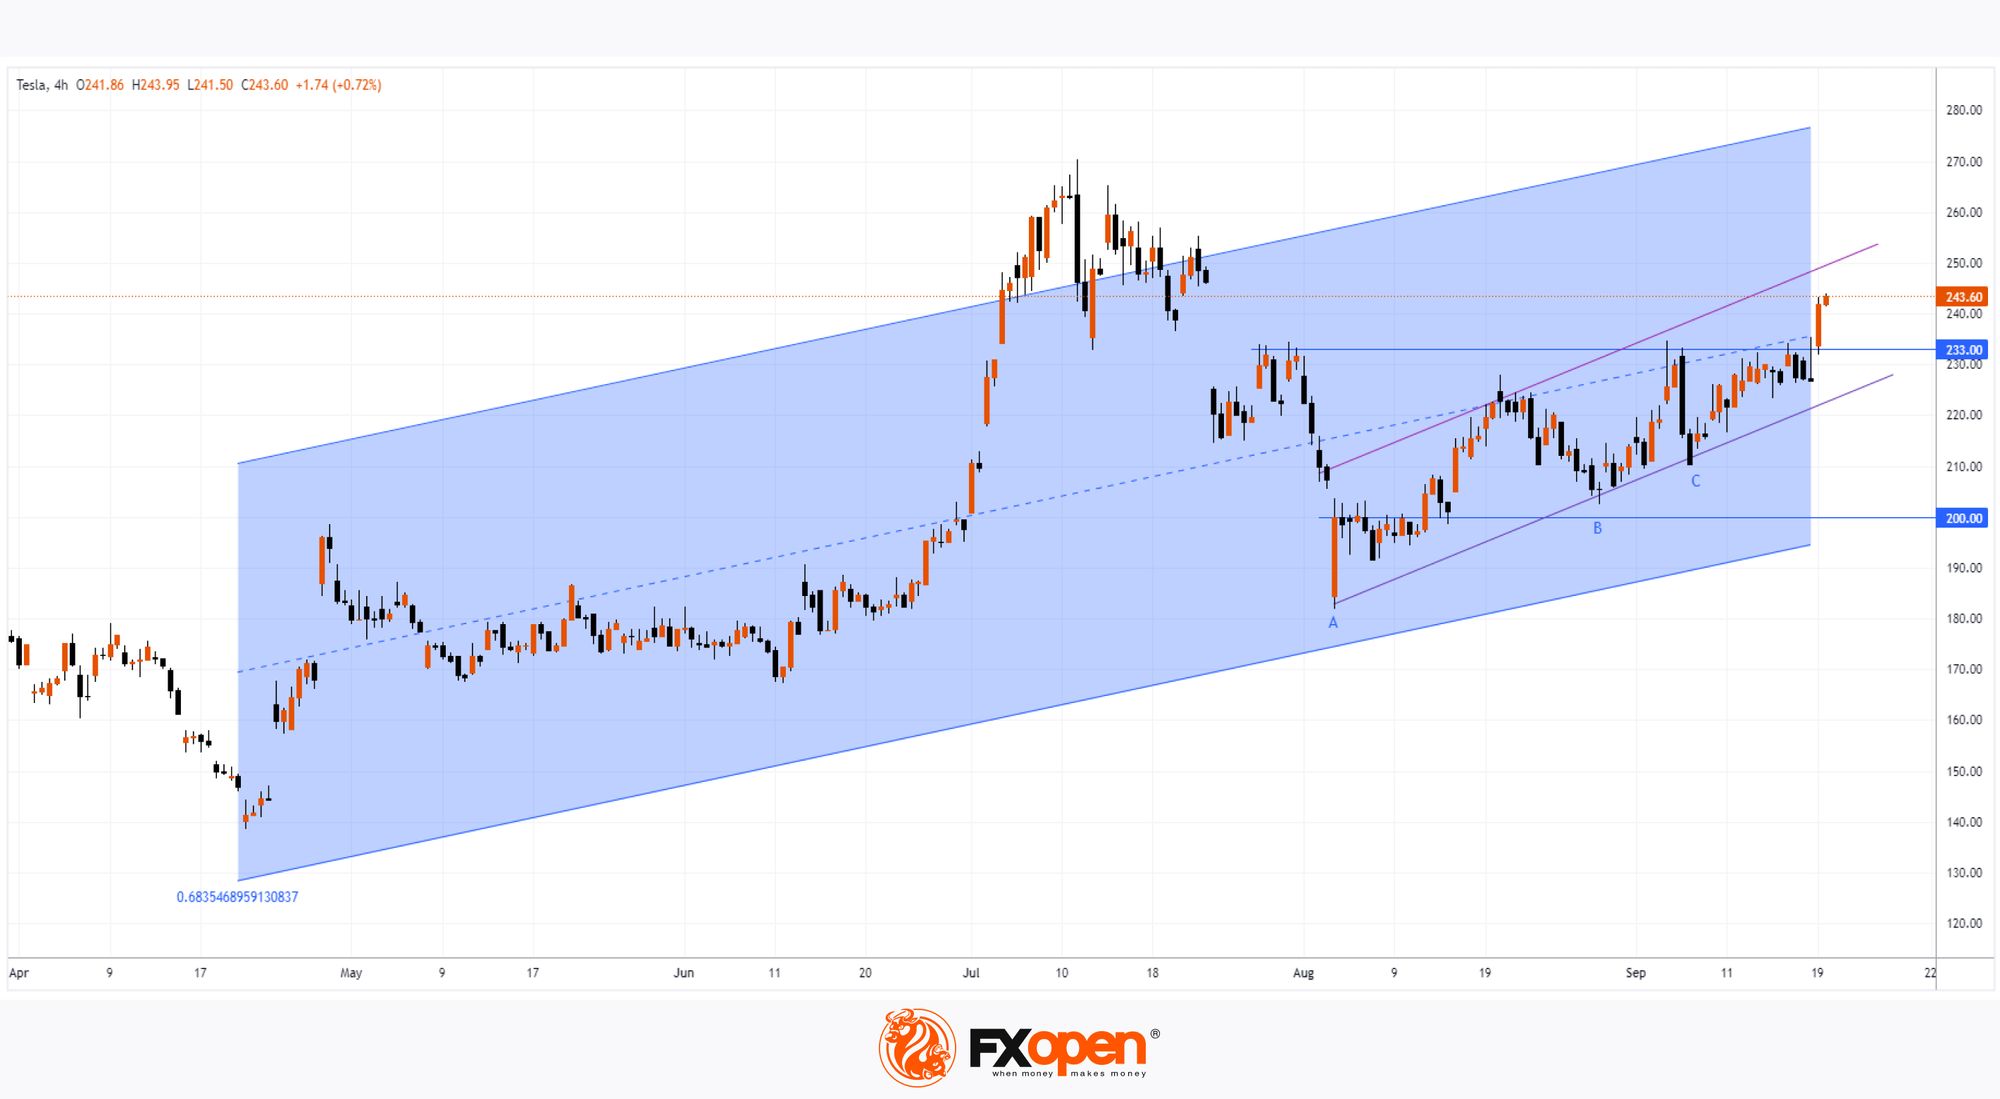
Today's technical analysis of the Tesla (TSLA) chart shows that:
→ The price has broken through the $233 resistance level, which had been exerting pressure since the end of July. Notably, the rising lows A-B-C (resembling a bullish cup and handle pattern) suggest that demand strength has been increasing over time, which ultimately led to the breakout.
→ The blue channel, constructed using the linear regression method, points to an upward trend, with the price entering the upper half of this channel – further confirmation of bullish sentiment.
On 16 August, when analysing the TSLA chart, we suggested that the $200 level could serve as a platform from which Tesla (TSLA) would begin its growth story. What’s next?
It’s possible that the bullish momentum accompanying the break of the $233 resistance will drive the price towards the upper boundary of the upward channel, which was formed from the lows of 5 August (shown in purple). This could result in closing the bearish gap from 24 July.
If so, it would motivate experts to raise their assessments, as they currently remain pessimistic. According to the average opinion of analysts surveyed by TipRanks, the 12-month price forecast for Tesla (TSLA) shares stands at $208.46, indicating the potential for a decline towards the lower boundary of the blue channel.
Buy and sell stocks of the world's biggest publicly-listed companies with CFDs on FXOpen’s trading platform. Open your FXOpen account now or learn more about trading share CFDs with FXOpen.
This article represents the opinion of the Companies operating under the FXOpen brand only. It is not to be construed as an offer, solicitation, or recommendation with respect to products and services provided by the Companies operating under the FXOpen brand, nor is it to be considered financial advice.
Stay ahead of the market!
Subscribe now to our mailing list and receive the latest market news and insights delivered directly to your inbox.


Latest articles

Market Analysis: GBP/USD Dips Further As EUR/GBP Regains Traction
GBP/USD failed to climb above 1.3500 and corrected some gains. EUR/GBP started a decent increase and might aim for more gains above 0.8700.
Important Takeaways for GBP/USD and EUR/GBP Analysis Today
· The British Pound


Market Insights with Gary Thomson: Oil, US Retail Sales & NFP in Focus
In this video, we’ll explore the key economic events and market trends, shaping the financial landscape. Get ready for insights into financial markets to help you navigate the week ahead. Let’s dive in!
In this episode of Market