


The US Stock Market Awaits the Publication of NFP And Unemployment Data
FXOpen

Important events of this week for investors and traders in the US stock market could be the employment news, which will be published tomorrow at 15:30 GMT+3:
→ non-Farm Payrolls (NFP) report for March. According to CNN, analysts expect nonfarm payrolls to rise by 192,500 in March. NFP for February was 275,000, according to FactSet.
→ data on the unemployment rate (Unemployment Rate). According to ForexFactory, the unemployment rate is expected to remain unchanged at 3.9%.
The state of the labour market is under close scrutiny by the Fed and could provide valuable insight into the prospects for interest rate cuts. The release of the unemployment rate and NFP numbers for March could be an example of what is called "bad news is good news" on Wall Street. After all, if the data shows a deterioration in the labour market, then this will be an argument for the Fed to lower interest rates, which in turn could lead to an increase in the stock market.
Indeed, according to CNN, Fed Chairman Jerome Powell said last week that a weakening labour market would be a reason to cut interest rates.
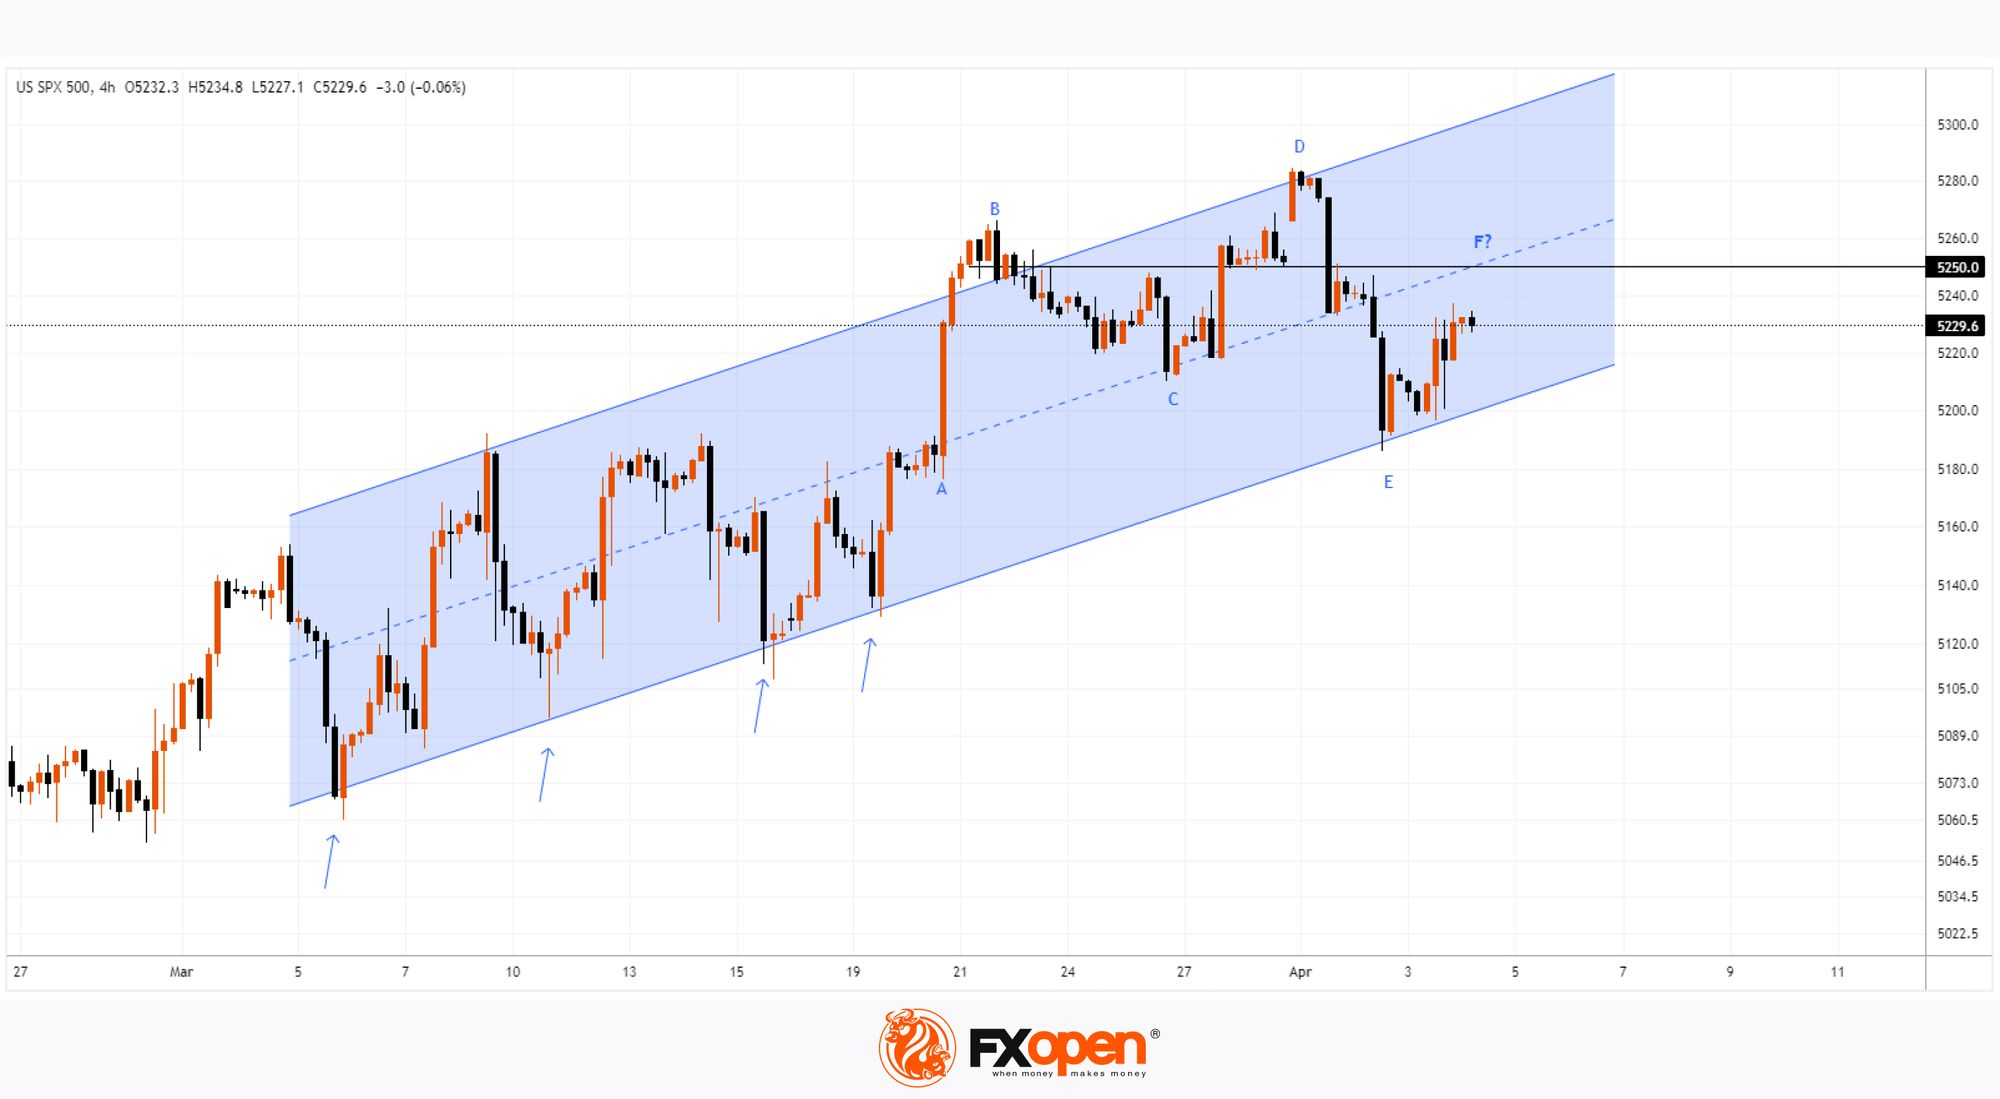
However, the S&P 500 chart shows the price moving within an ascending channel, but showing signs of weakness around the 5,250 level on the 4-hour period:
- After a sharp increase in A→B, the price entered a prolonged correction B→C - this may be a sign of a large volume of sell orders near the level of 5,250, which absorbed the bullish impulse A→B.
- An attempt to break through the level of 5,250 (price growth to top D) turned out to be a failure, as the price sharply dropped from the upper border of the channel to the lower one. Such progress should be alarming for the bears.
From the point of view of technical analysis of the S&P 500, on the eve of the publication of the NFP report, the price forms a rebound from the lower border of the channel. But by its nature, the rebound does not look dynamic compared to the previous ones (shown by arrows) — the price’s action shows that this time it needs time to approach the median line.
The above arguments provide the basis for the assumption that the publication of the unemployment rate and the NFP report for March can become drivers of price movement, at which it will form an F top.
Wherein:
→ the tops of B-D-F can form a bearish head and shoulders pattern;
→ the median line of the ascending channel and the level of 5,250 will act as resistance for the bulls.
Trade global index CFDs with zero commission and tight spreads (additional fees may apply). Open your FXOpen account now or learn more about trading index CFDs with FXOpen.
This article represents the opinion of the Companies operating under the FXOpen brand only. It is not to be construed as an offer, solicitation, or recommendation with respect to products and services provided by the Companies operating under the FXOpen brand, nor is it to be considered financial advice.
Stay ahead of the market!
Subscribe now to our mailing list and receive the latest market news and insights delivered directly to your inbox.


Latest articles

Amazon Earnings: Does the Chart Already Know Something the Numbers Don't?
All eyes are on July 30, when Amazon reports Q2 2026 earnings, with Wall Street increasingly convinced the bar has been set too low. Consensus sees EPS near $1.82-$2.26 on roughly $197 billion in revenue, but the

WTI Analysis: Gap Breaks Short-Term Trend as Price Remains Trapped Between the POC and Profile Boundary
WTI crude oil plunged by more than 7% on 27 July 2026 after the US suspended a series of strikes against Iran over the weekend, raising hopes of a diplomatic solution and the reopening of shipping through the Strait of

US Dollar Index: A Defining Week for the King of the Markets
The dollar heads into a pivotal week trading near 101.80, just off a 15-month high, with the Fed's July 29 meeting standing as the clear focal point. Markets currently price roughly a 65% chance of a hold, though renewed