


Trump’s Decision Shakes Global Financial Markets
FXOpen
On Friday, 10 October, President Trump made an unexpected statement about the possible introduction of 100% tariffs on Chinese goods, triggering sharp price swings across global markets:
→ Stock markets: The S&P 500 index (US SPX 500 mini on FXOpen) tumbled by more than 3%, hitting its lowest level in over a month.
→ Currency markets: The US dollar slumped sharply against other major currencies.
→ Cryptocurrency markets: Bitcoin plunged from above $125k to below $110k, while other digital assets followed suit, leading to the largest long-position liquidation in history.
However, on Sunday, Donald Trump softened his tone on Truth Social, suggesting that trade relations with Beijing “will be absolutely fine”. Vice President JD Vance echoed this sentiment, adding that the United States is ready for talks if China is “prepared to act reasonably”.
This shift in rhetoric from US officials helped markets recover, with the S&P 500 index (US SPX 500 mini on FXOpen) rebounding sharply at Monday’s open, reclaiming much of Friday’s losses.
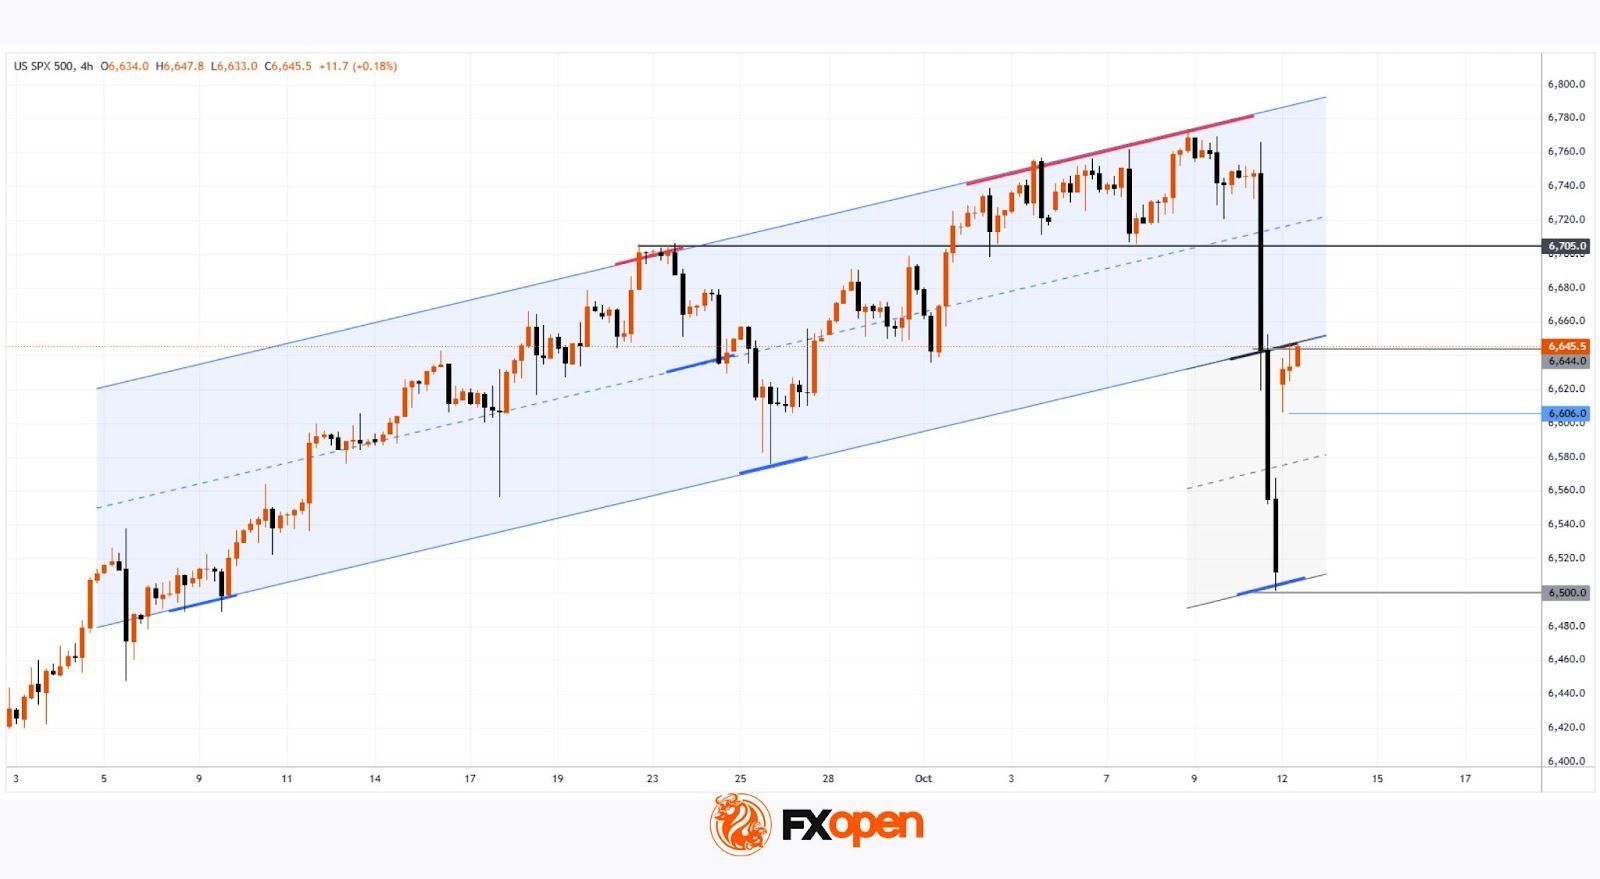
Technical Analysis of the S&P 500 Chart
In our previous analysis of the 4-hour S&P 500 chart (US SPX 500 mini on FXOpen) on 3 October, we identified an upward channel (shown in blue) and expressed several concerns:
→ The price was approaching the upper boundary of the channel, where long positions are often closed for profit.
→ The latest peak slightly exceeded the October high (A), suggesting a potential bearish divergence.
→ The news blackout caused by the government shutdown created an “information vacuum”, which could quickly turn sentiment negative if filled with adverse developments.
The lower boundary of the blue channel offered only temporary support near 6,644 points on Friday before the price broke downwards. Doubling the channel width provides a projected target near 6,500, which coincides with Friday’s low.
Given these factors, it can be assumed that the lower line of the blue channel now acts as the median of a broader range following Friday’s sell-off. This suggests that in the coming days, the S&P 500 index may stabilise as demand and supply find temporary balance along this line.
Looking further ahead, the situation may resemble that of early April, when after a panic-driven market drop (also triggered by Trump’s tariff comments), the S&P 500 not only fully recovered but went on to reach new highs.
Key Levels:
→ 6,705 – a level that has acted as both support and resistance this autumn;
→ 6,606 – the boundary of the bullish gap.
Trade global index CFDs with zero commission and tight spreads (additional fees may apply). Open your FXOpen account now or learn more about trading index CFDs with FXOpen.
This article represents the opinion of the Companies operating under the FXOpen brand only. It is not to be construed as an offer, solicitation, or recommendation with respect to products and services provided by the Companies operating under the FXOpen brand, nor is it to be considered financial advice.
Stay ahead of the market!
Subscribe now to our mailing list and receive the latest market news and insights delivered directly to your inbox.


Latest articles
AUD/USD: Will the RBA Be Able to Keep Its Currency Strong?
As the chart shows, AUD/USD has entered a distinctly bearish phase in recent weeks, reflecting the broader consolidation — and in some cases outright weakness — that the US dollar has begun imposing across most major currency pairs.
Fundamental Analysis
The
AUD/CAD: Pair Remains Range-Bound Amid Interest Rate Divergence
The key macroeconomic factor for AUD/CAD remains the divergence in monetary policy between the two central banks. After three consecutive rate hikes since the beginning of the year, the Reserve Bank of Australia left its cash rate unchanged at

Brent Crude Oil Analysis: Stabilisation or Simply a Pause?
Over the past few weeks, financial markets have been more focused than ever on developments surrounding the Strait of Hormuz — a critical waterway at the centre of ongoing US-Iran negotiations. The back-and-forth of diplomatic headlines has injected significant volatility into