


FXOpen

As today's TSLA chart shows, the stock price rose by approximately 6% during yesterday's trading, surpassing the $209 per share level. This marks the highest point since 24 January this year.
The price increase was driven by optimism related to the release of second-quarter car sales data. It is expected that Tesla might report a decline in sales, but not as significant as it could have been.
Analysts surveyed by Bloomberg estimate that the automaker will report sales of around 440,000 electric vehicles in the second quarter, which is 5.8% less than a year ago.
Factors contributing to the decline in sales include:
→ The suspected arson at the Tesla factory in Berlin;
→ Changes in the supply chain due to attacks in the Red Sea;
→ A reduction of approximately 10% in the company's workforce, announced by Musk in April.
However, the main factor could be competition and Tesla's aging model lineup. Can the TSLA price maintain its current high?
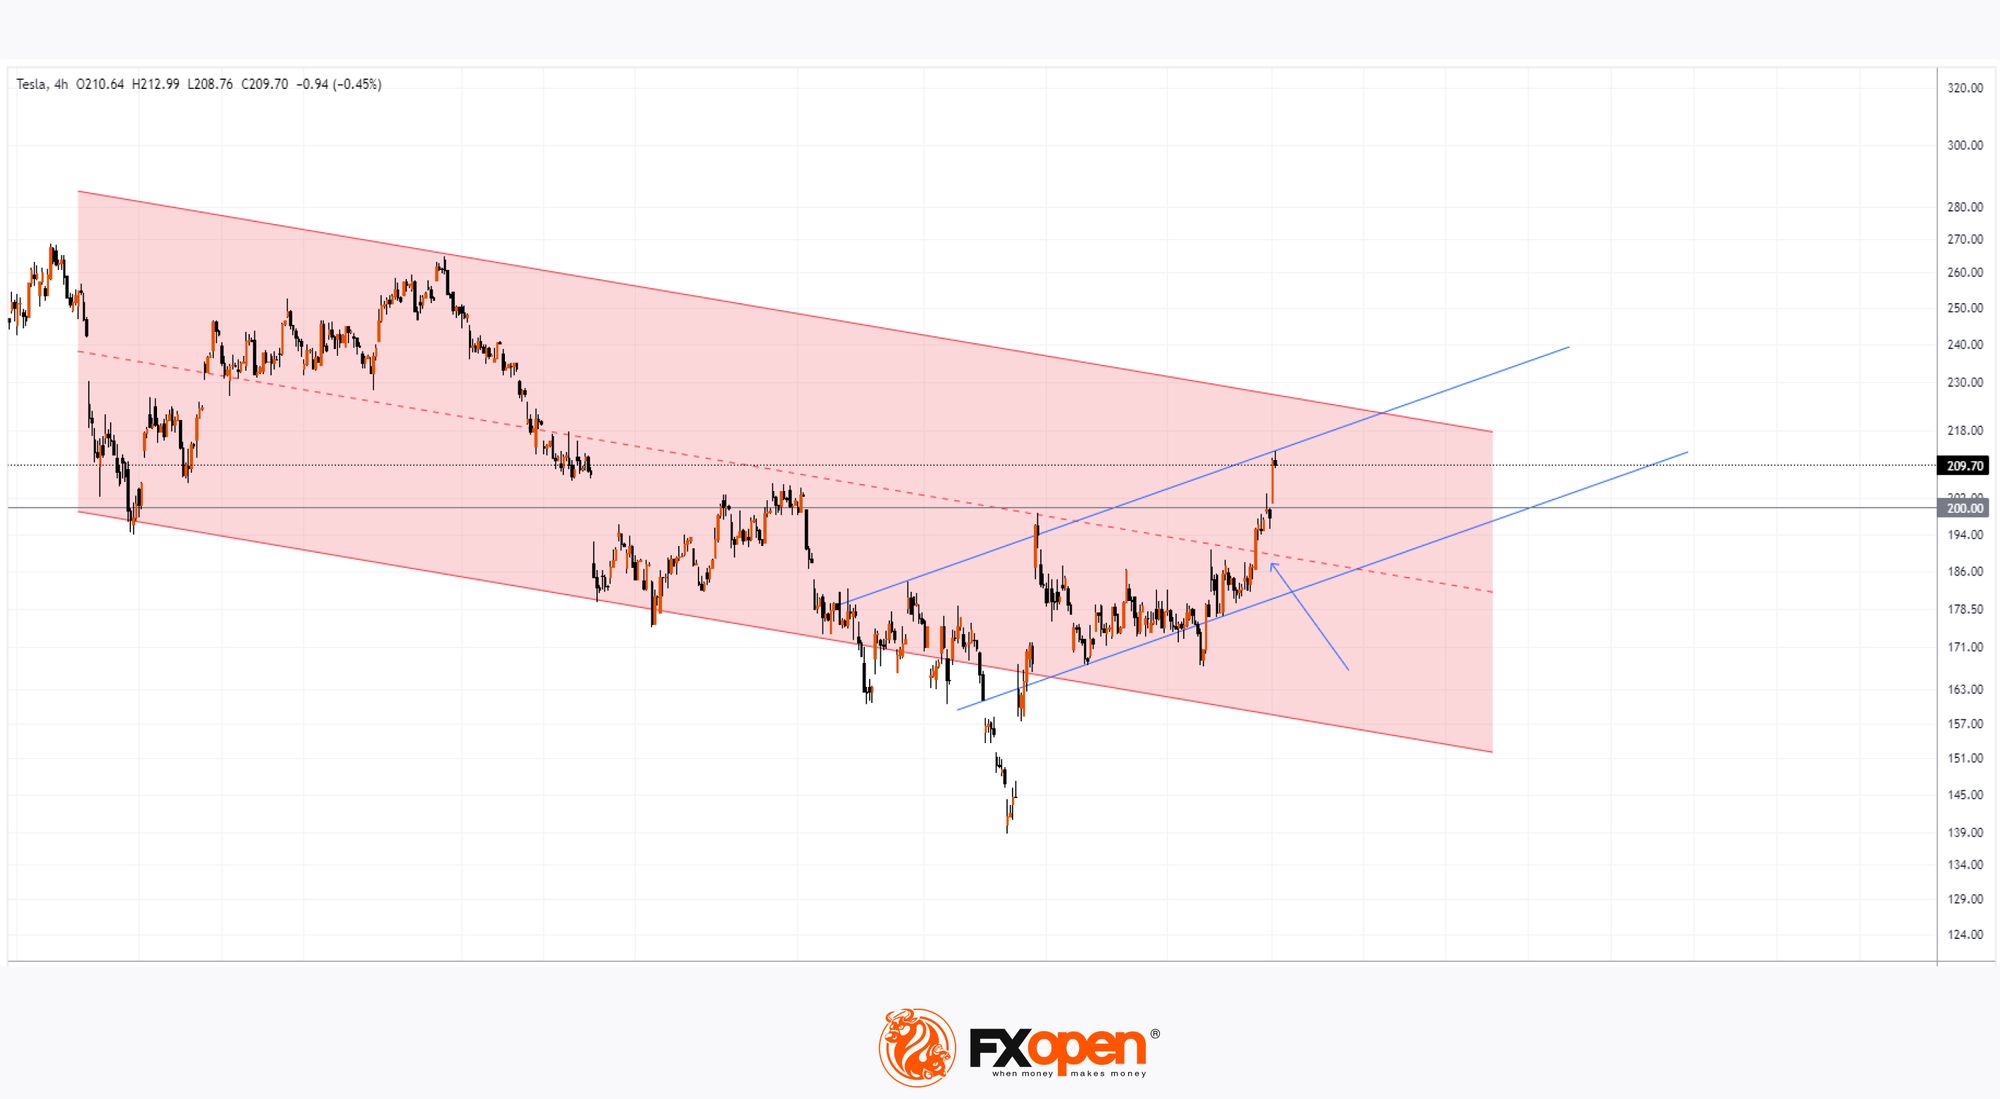
Technical analysis of today's TSLA chart shows that:
→ The price is still within the descending channel (marked in red), but has already broken upwards through its median (indicated by an arrow) – a sign of demand;
→ On 5 April, we mentioned that the TSLA price could rise to the psychological level of $150 per share. At that time, the market was oversold, with the price below the lower boundary of the descending channel. Since then, the price has formed an upward trajectory (shown in blue);
→ The price is above the psychological level of $200 per share.
Regardless of the report's outcome, for bulls, an important achievement will be the ability to stay in the upper half of the ascending channel and above the psychological level of $200 per share. This would boost their confidence ahead of Tesla's upcoming second-quarter corporate report, scheduled for 17 July.
Read analytical TSLA price forecasts for 2024 and beyond.
Buy and sell stocks of the world's biggest publicly-listed companies with CFDs on FXOpen’s trading platform. Open your FXOpen account now or learn more about trading share CFDs with FXOpen.
This article represents the opinion of the Companies operating under the FXOpen brand only. It is not to be construed as an offer, solicitation, or recommendation with respect to products and services provided by the Companies operating under the FXOpen brand, nor is it to be considered financial advice.
Stay ahead of the market!
Subscribe now to our mailing list and receive the latest market news and insights delivered directly to your inbox.


Latest articles

AUD/USD Falls Below Key Support
As the AUD/USD chart indicates, the Australian dollar is showing weakness against the US dollar at the start of the week. Notably, we are seeing a bearish breakout below the lower boundary of an important ascending channel that had

Gold Price Falls to 2026 Low
As the XAU/USD chart indicates, today, shortly after the start of the trading week, gold fell below $4,150 (the low of the year). The last time prices were at this level was in early December 2025, before the

Market Analysis: Gold Hit Hard While WTI Crude Oil Rallies on Intensifying Iran Crisis
Gold price extended losses below $4,500 before the bulls appeared. WTI Crude oil prices are rising and could climb further higher toward $105.00.
Important Takeaways for Gold and WTI Crude Oil Prices Analysis Today
· Gold price failed to