


US 30 Analysis: Dow Jones Finds Support
FXOpen

September is likely to be the second month in a row that the Dow Jones (US 30) stock market index declined. The last time this happened was... also in September, a year ago.
Important economic data was published yesterday:
→ According to a revised report released by the Bureau of Economic Analysis, US real GDP increased 2.1% year over year in the second quarter. This reduces the risk of recession.
→ The number of applications for unemployment benefits amounted to 204k for a week, which continues the downward trend that has emerged since June of this year.
Today, fresh data on the PCE inflation index will be published, it can provide evidence that inflation is slowly subsiding as long as the economy remains resilient.
More bullish arguments for displaying cautious optimism are provided by the Dow Jones index chart:
→ the price of US 30 has formed an inverted head-and-shoulders pattern (SHS);
→ this bullish pattern formed near the lower border of the descending channel — which indicates support from this line;
→ after Wednesday, when the bearish acceleration was noticeable, the price recovered — this is a sign that if there were panic sentiments, they have exhausted themselves.
→ On Thursday, the bears’ attempts to resume the decline failed, and Friday morning looks optimistic – during the Asian session the price exceeded Thursday’s high.
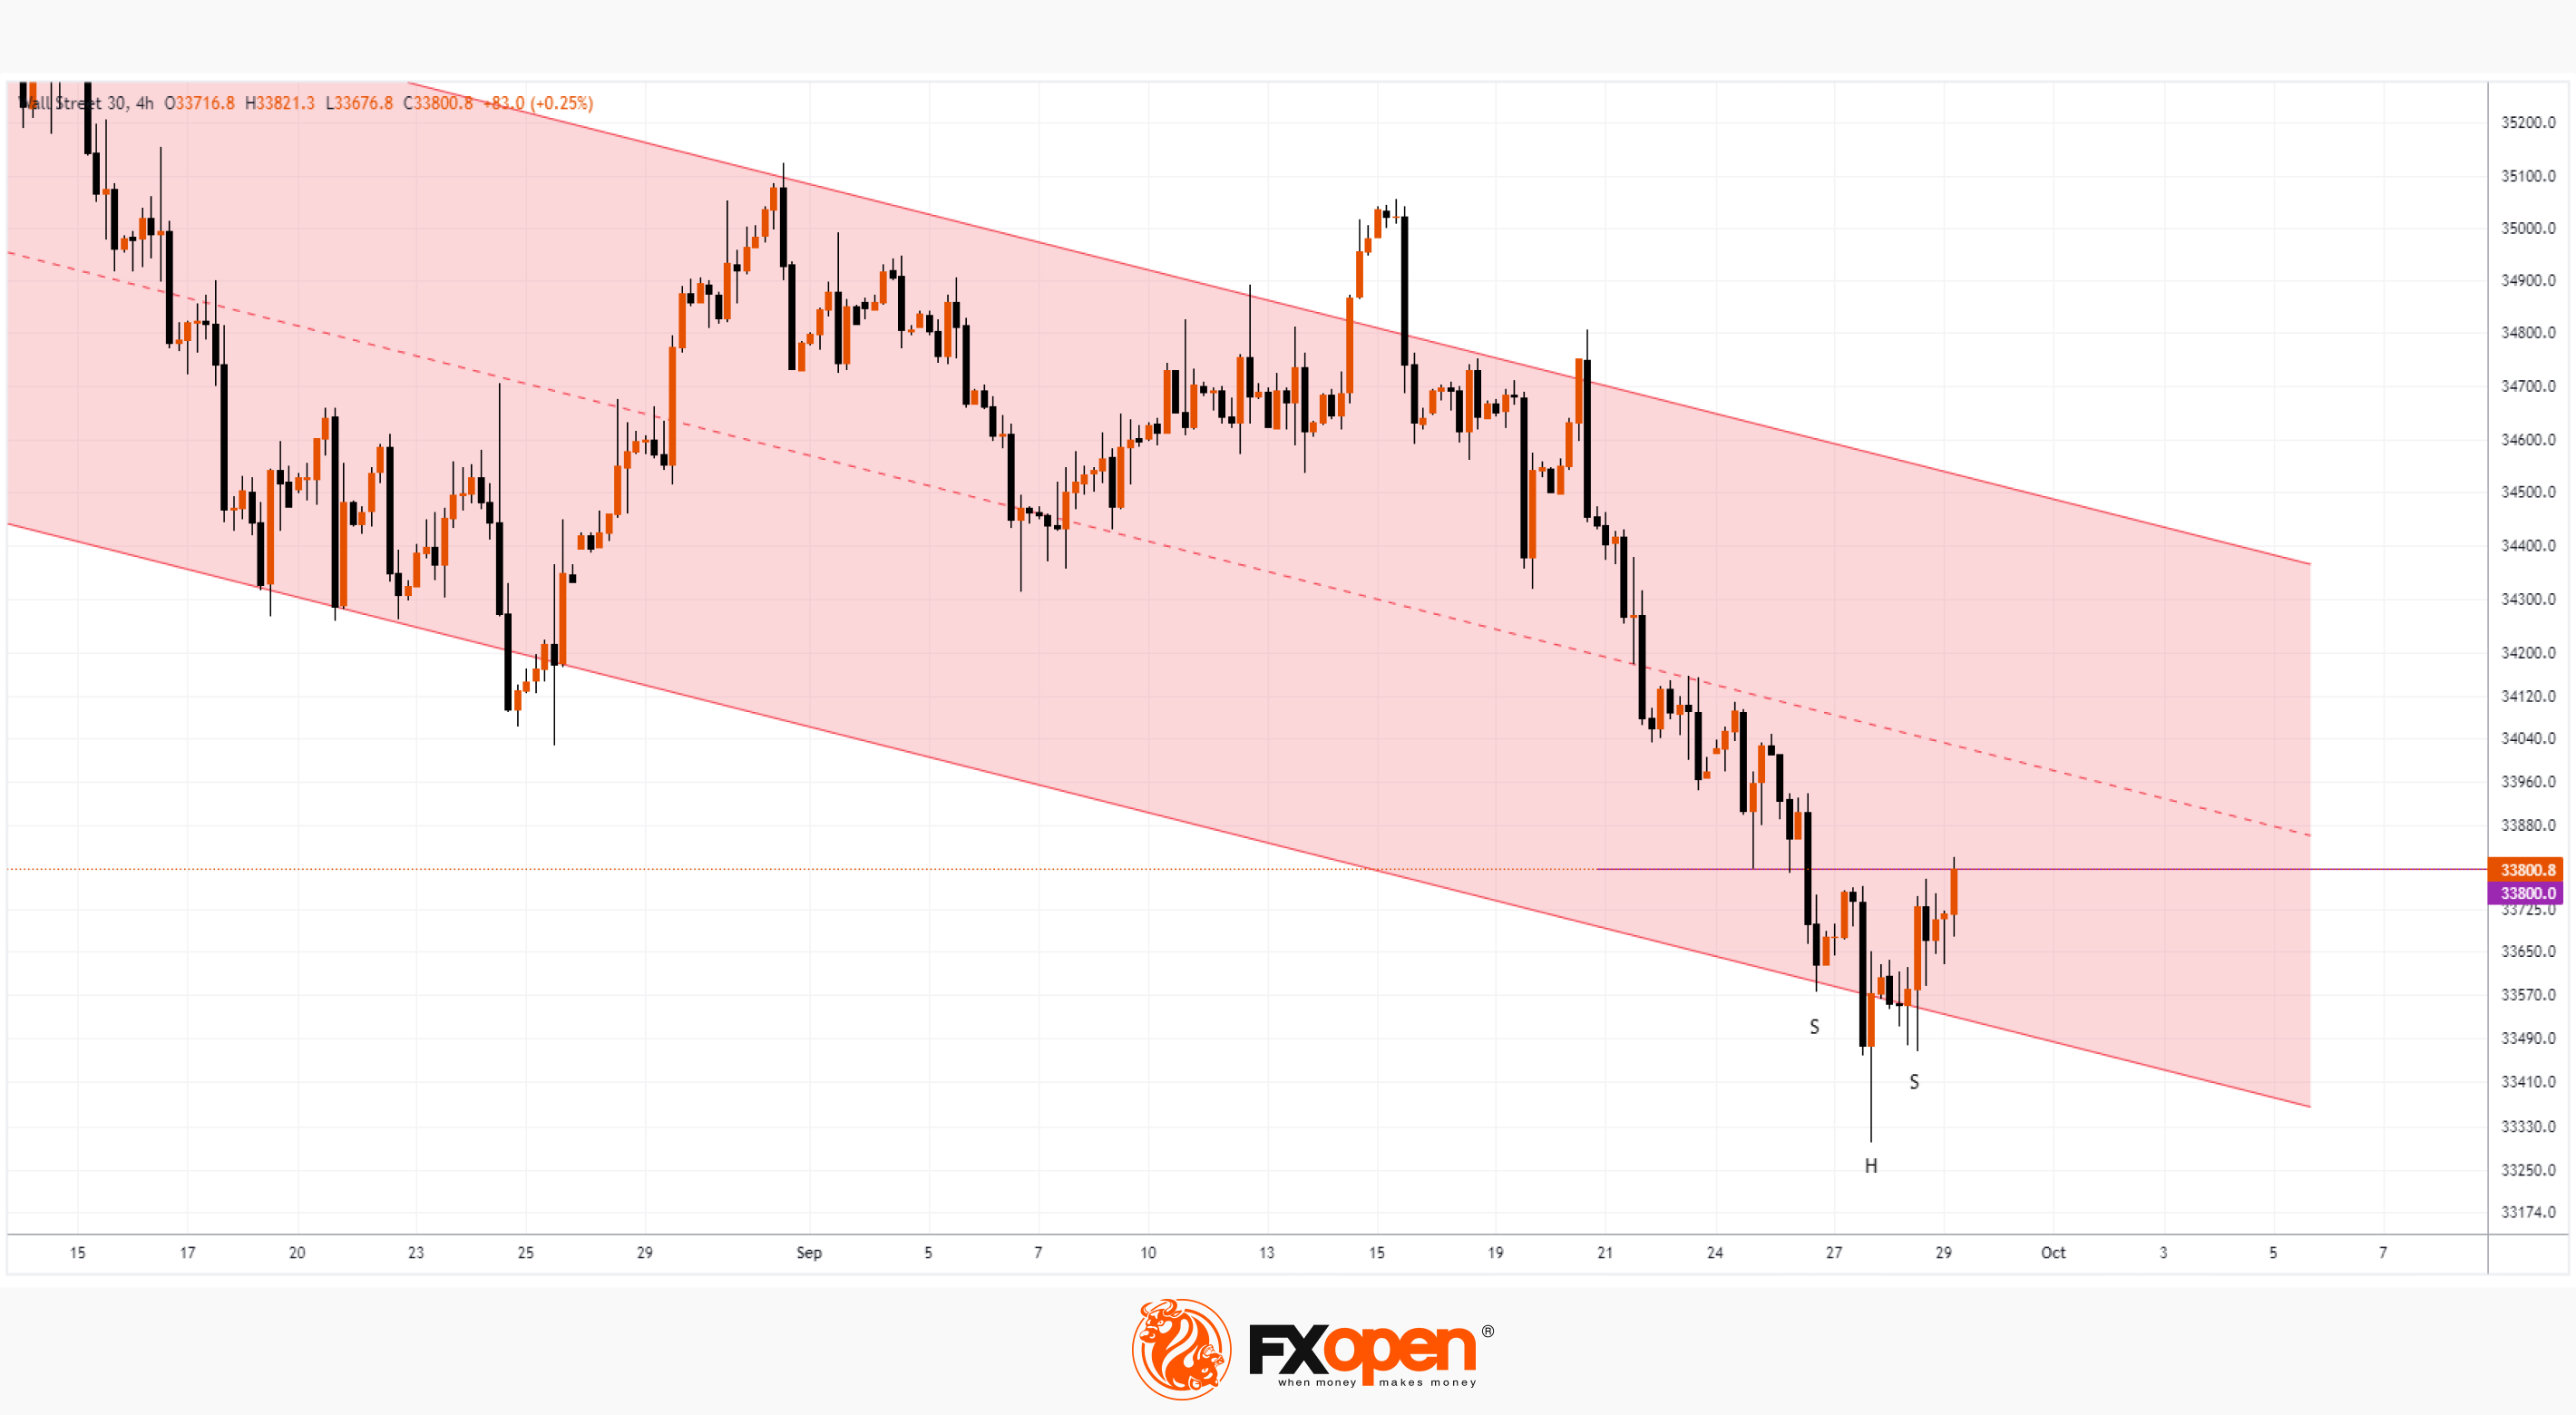
The market will receive more bullish arguments if the price can consolidate above the resistance of 33,800, which is the neck line of SHS.
Perhaps the tone for the rally is being set by insiders who have information that the risk of a government shutdown in the US is being minimized. If the emerging optimism continues for a longer period of time, then October will be able to interrupt the pattern of 2 bearish candles on the monthly chart, as was the case last year.
Trade global index CFDs with zero commission and tight spreads (additional fees may apply). Open your FXOpen account now or learn more about trading index CFDs with FXOpen.
This article represents the opinion of the Companies operating under the FXOpen brand only. It is not to be construed as an offer, solicitation, or recommendation with respect to products and services provided by the Companies operating under the FXOpen brand, nor is it to be considered financial advice.
Stay ahead of the market!
Subscribe now to our mailing list and receive the latest market news and insights delivered directly to your inbox.


Latest articles

AI Valuations Are Back in the Spotlight
Artificial intelligence remains the dominant investment theme of 2026, but investors are increasingly questioning whether AI stock valuations are keeping pace with reality.
💰 Big Tech continues to invest at an unprecedented scale, with hyperscaler AI spending projected to exceed $800

AUD/CAD: Months of Indecision — Is a Breakout Finally Coming?
The Australian dollar has clawed back most of its end-of-June losses, when it touched three-month lows against the greenback amid escalating Middle East tensions. Since then, sentiment has improved: the RBA's Assistant Governor Sarah Hunter signalled the board stands ready

USD/JPY: Battling at the Top of the Triangle
On 3 July, Japan's Finance Minister, Satsuki Katayama, stated that the Ministry of Finance remains in close contact with US authorities regarding developments in USD/JPY as the yen traded near its weakest level in almost 40 years. Similar verbal