


US500: The Market Has Been Growing without Corrections by 2% for 266 Consecutive Trading Sessions
FXOpen
The S&P 500 remains in its longest rally since 2018 without a decline of at least 2%, according to data compiled by Bloomberg; analysts note that there hasn't been a correction of this size in 266 trading sessions.
The positive sentiment of market participants is due to:
→ the prospect of lowering interest rates by the Federal Reserve;
→ enthusiasm for AI and its positive impact on economic development.
However, although the fundamental background is strong, current estimates of the US500 index may be overestimated — in fact, this is the essence of the correction.
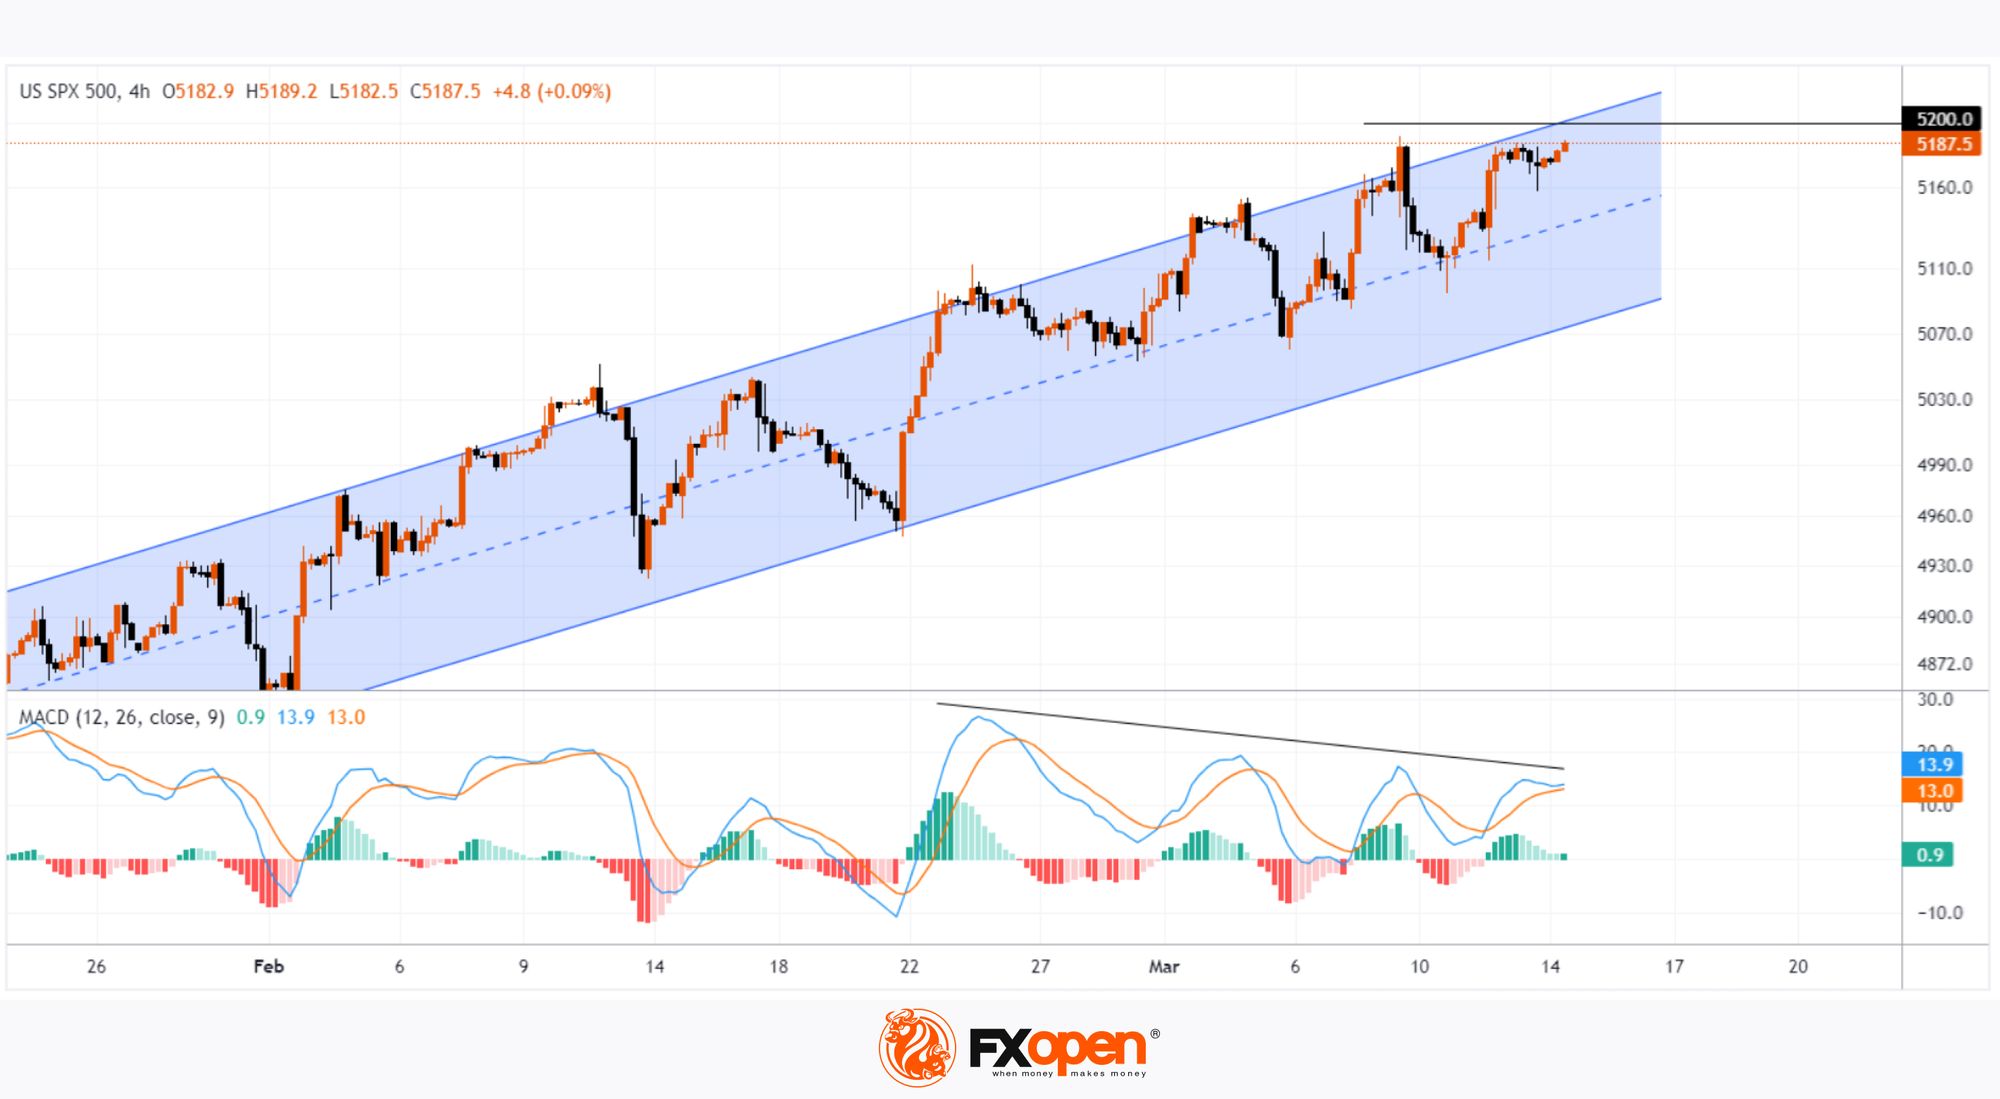
The US500 chart shows that:
→ the price is in an upward trend (shown by the blue channel);
→ the price moves in the upper half of the channel, and the median line acts as support — a sign of strong demand;
→ on the morning of March 14, the market is showing signs of positivity, indicating that an attempt to overcome the resistance of 5,200 points and take a new record high may be made in the near future.
However, the MACD is holding back optimism — the popular oscillator is forming a bearish divergence pattern, which hints at the gradual fading of bullish impulses.
Given the above, bulls should be cautious as the market looks vulnerable to a correction, such as to the lower border of the channel. But this requires a trigger. One of these could be news about inflation in the US; the values of the Producer Price Index (as well as data on retail sales in the US) will be published today at 15:30 GMT+3. Be prepared for spikes in volatility.
Trade global index CFDs with zero commission and tight spreads (additional fees may apply). Open your FXOpen account now or learn more about trading index CFDs with FXOpen.
This article represents the opinion of the Companies operating under the FXOpen brand only. It is not to be construed as an offer, solicitation, or recommendation with respect to products and services provided by the Companies operating under the FXOpen brand, nor is it to be considered financial advice.
Stay ahead of the market!
Subscribe now to our mailing list and receive the latest market news and insights delivered directly to your inbox.


Latest articles

AI Valuations Are Back in the Spotlight
Artificial intelligence remains the dominant investment theme of 2026, but investors are increasingly questioning whether AI stock valuations are keeping pace with reality.
💰 Big Tech continues to invest at an unprecedented scale, with hyperscaler AI spending projected to exceed $800

AUD/CAD: Months of Indecision — Is a Breakout Finally Coming?
The Australian dollar has clawed back most of its end-of-June losses, when it touched three-month lows against the greenback amid escalating Middle East tensions. Since then, sentiment has improved: the RBA's Assistant Governor Sarah Hunter signalled the board stands ready

USD/JPY: Battling at the Top of the Triangle
On 3 July, Japan's Finance Minister, Satsuki Katayama, stated that the Ministry of Finance remains in close contact with US authorities regarding developments in USD/JPY as the yen traded near its weakest level in almost 40 years. Similar verbal