


USD/JPY Analysis: New High of the Year
FXOpen

Yesterday, for the first time in 2023, the yen weakened to 150.7 per US dollar.
Thus, since the beginning of autumn, the yen has weakened by 3.5%, continuing the trend of 2023, which is due to the difference in the monetary policies of the two countries.
The Fed is pursuing a high rate policy. Yesterday's news testified to the stability of the economy, as US GDP is growing: fact = 4.9% in annual terms; expected = 4.5%; quarter ago = 2.4%. This provides a cushion for the Fed to continue keeping rates high to combat inflation.
At the same time, the Bank of Japan continues its ultra-loose policy, keeping the rate below zero. Today's news showed that Japan's CPI was: actual = 2.7%, expected = 2.5%, a month ago = 2.5%. That is, inflation in Tokyo is raising its head, which increases pressure on the Bank of Japan.
The Bank of Japan meeting will be held next week; on Tuesday, market participants may receive important news about the authorities' response to the weak yen and rising inflation. The chart shows that traders are afraid that the USD/JPY rate could drop sharply because progress in the development of the current trend is slowing down.
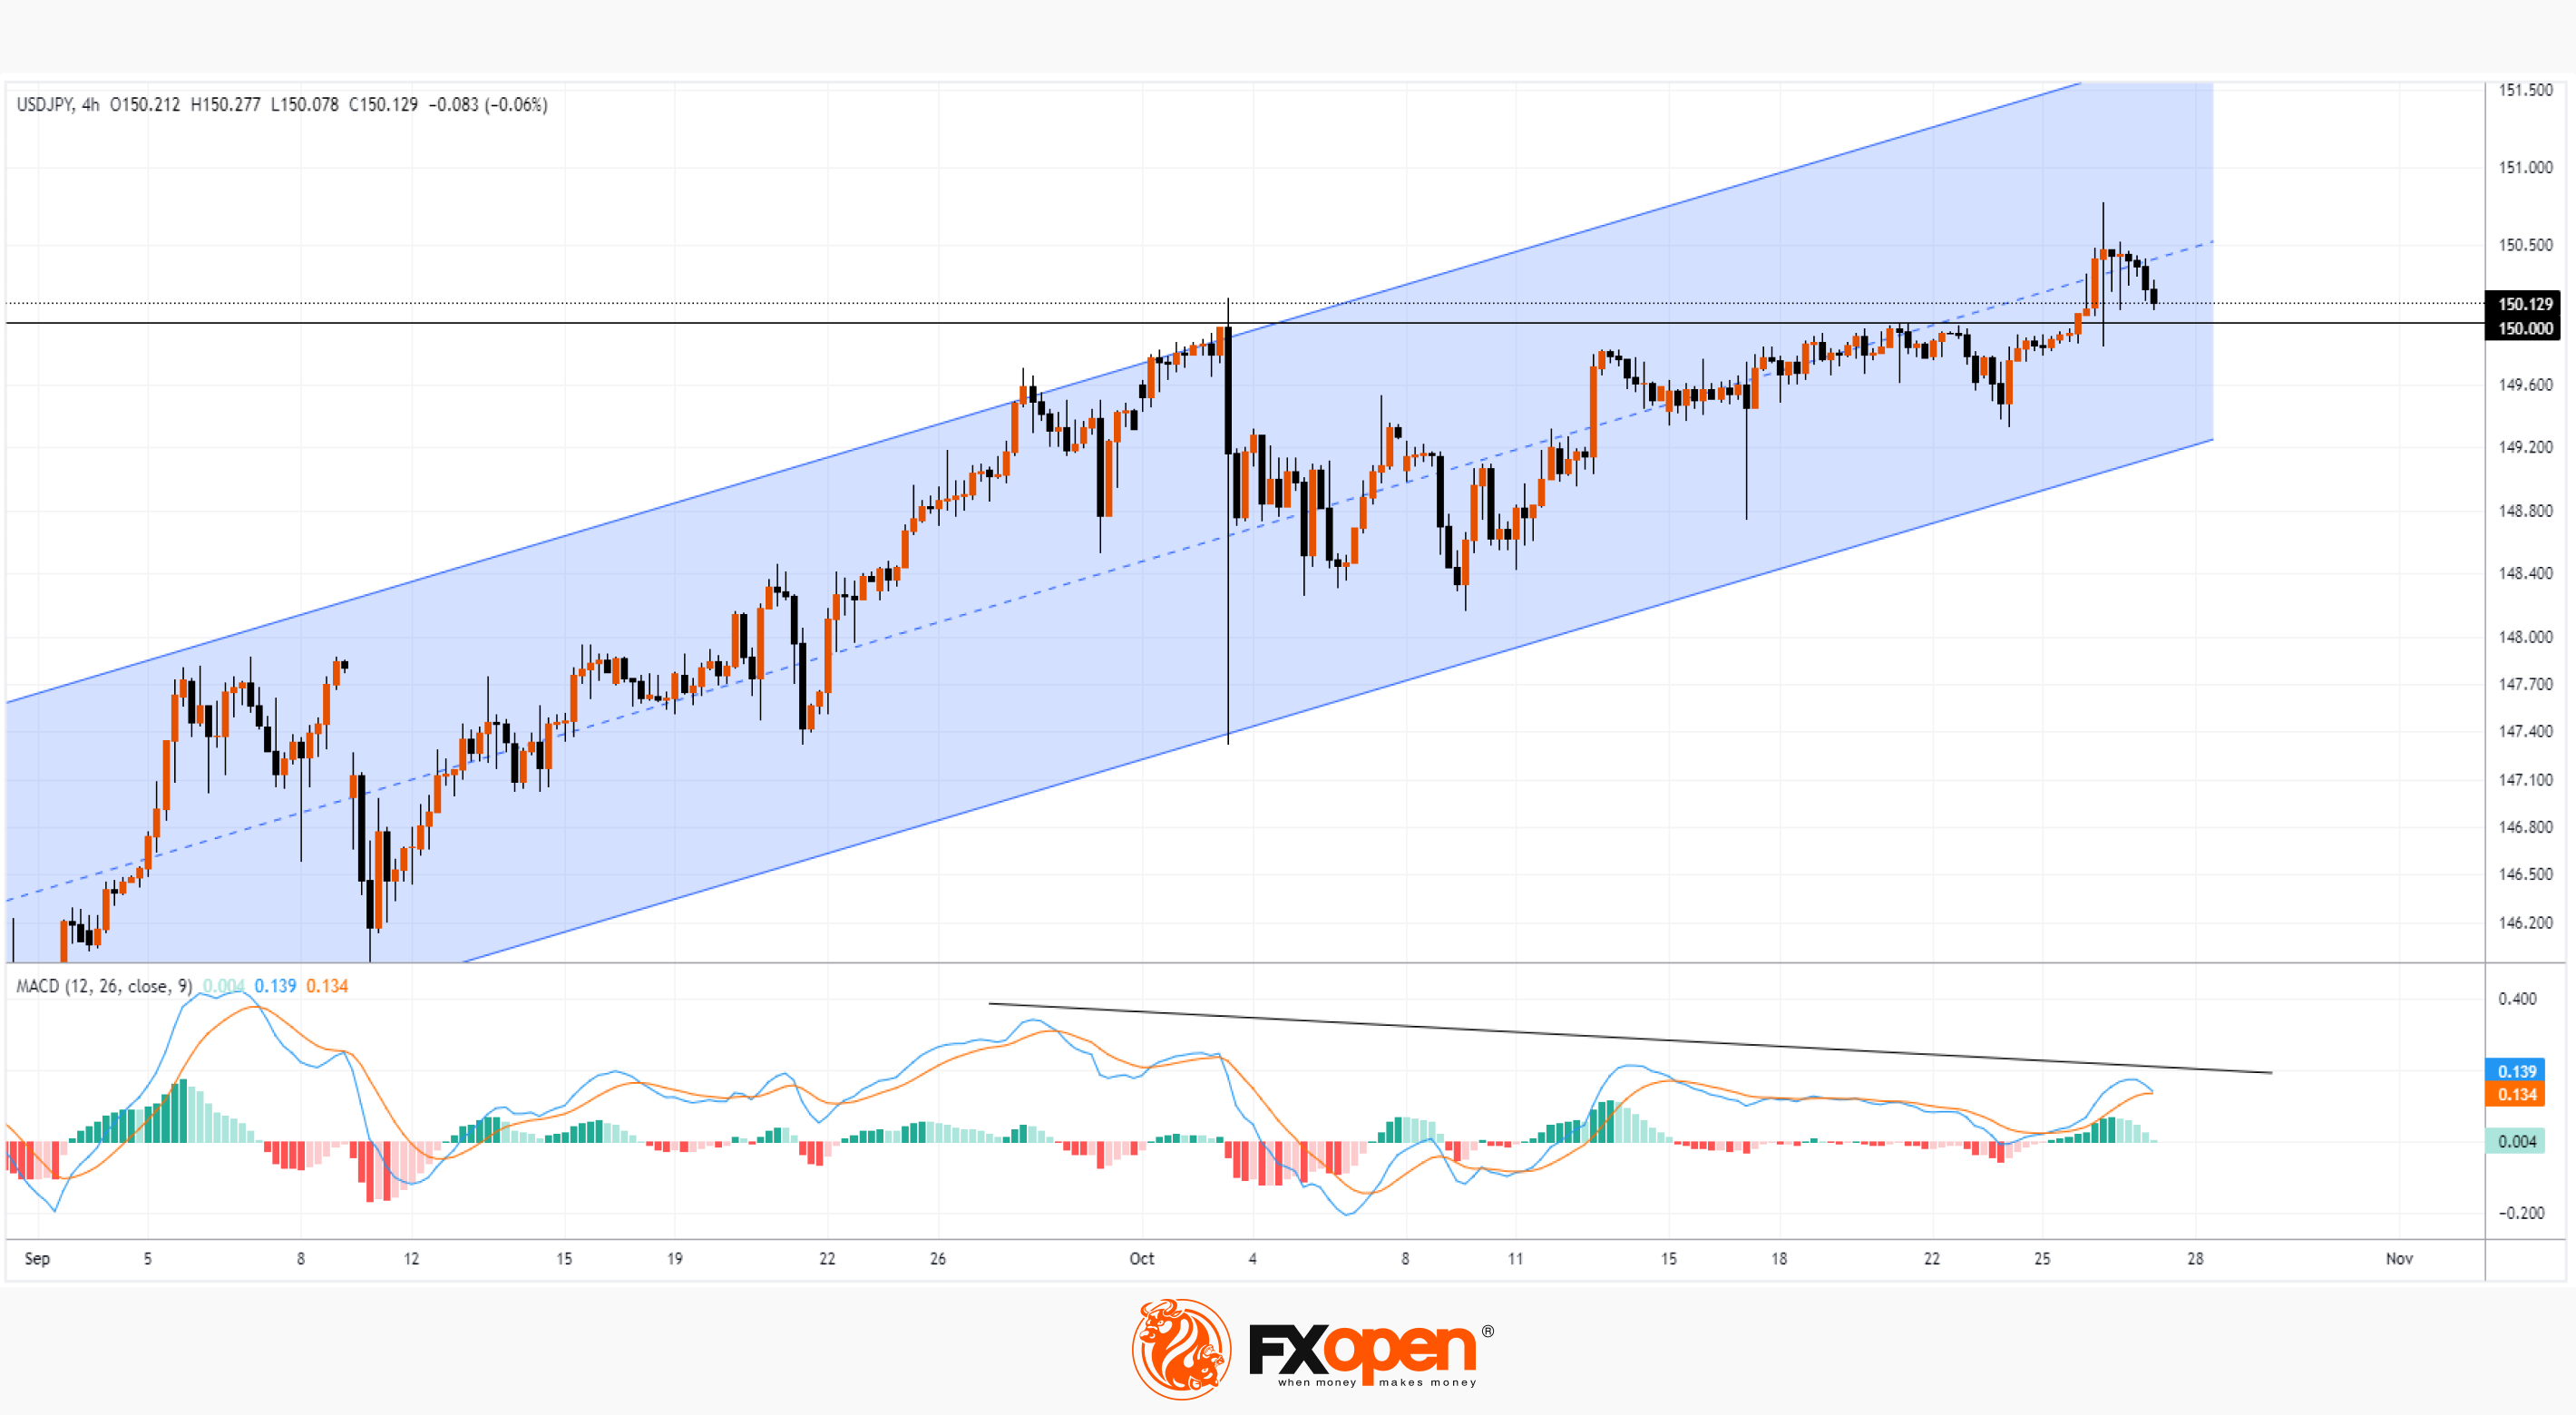
Note:
→ the divergence on the MACD indicator. The pressure of the bulls weakens;
→ having reached the high of the year, the price shows bearish dynamics today, showing the market’s unwillingness to gain a foothold at the top;
→ the upper boundary of the channel already seems unattainable;
→ the bullish momentum on October 25-26 may turn out to be a trap if the October 3 high is broken.
If the Bank of Japan takes real measures to support the yen, the USD/JPY rate may break down the current channel shown in blue.
Trade over 50 forex markets 24 hours a day with FXOpen. Take advantage of low commissions, deep liquidity, and spreads from 0.0 pips (additional fees may apply). Open your FXOpen account now or learn more about trading forex with FXOpen.
This article represents the opinion of the Companies operating under the FXOpen brand only. It is not to be construed as an offer, solicitation, or recommendation with respect to products and services provided by the Companies operating under the FXOpen brand, nor is it to be considered financial advice.
Stay ahead of the market!
Subscribe now to our mailing list and receive the latest market news and insights delivered directly to your inbox.


Latest articles

AUD/CAD: Months of Indecision — Is a Breakout Finally Coming?
The Australian dollar has clawed back most of its end-of-June losses, when it touched three-month lows against the greenback amid escalating Middle East tensions. Since then, sentiment has improved: the RBA's Assistant Governor Sarah Hunter signalled the board stands ready

USD/JPY: Battling at the Top of the Triangle
On 3 July, Japan's Finance Minister, Satsuki Katayama, stated that the Ministry of Finance remains in close contact with US authorities regarding developments in USD/JPY as the yen traded near its weakest level in almost 40 years. Similar verbal

Dow Jones (DJIA): Consolidation Beyond the Trend
Federal Reserve Chair Kevin Warsh testified before Congress on 14–15 July, reaffirming the Fed's commitment to bringing inflation back to target while providing no clear guidance on the future path of interest rates. Meanwhile, June inflation data came in