


USD/JPY Analysis: Price Retreats from One-Month High
FXOpen

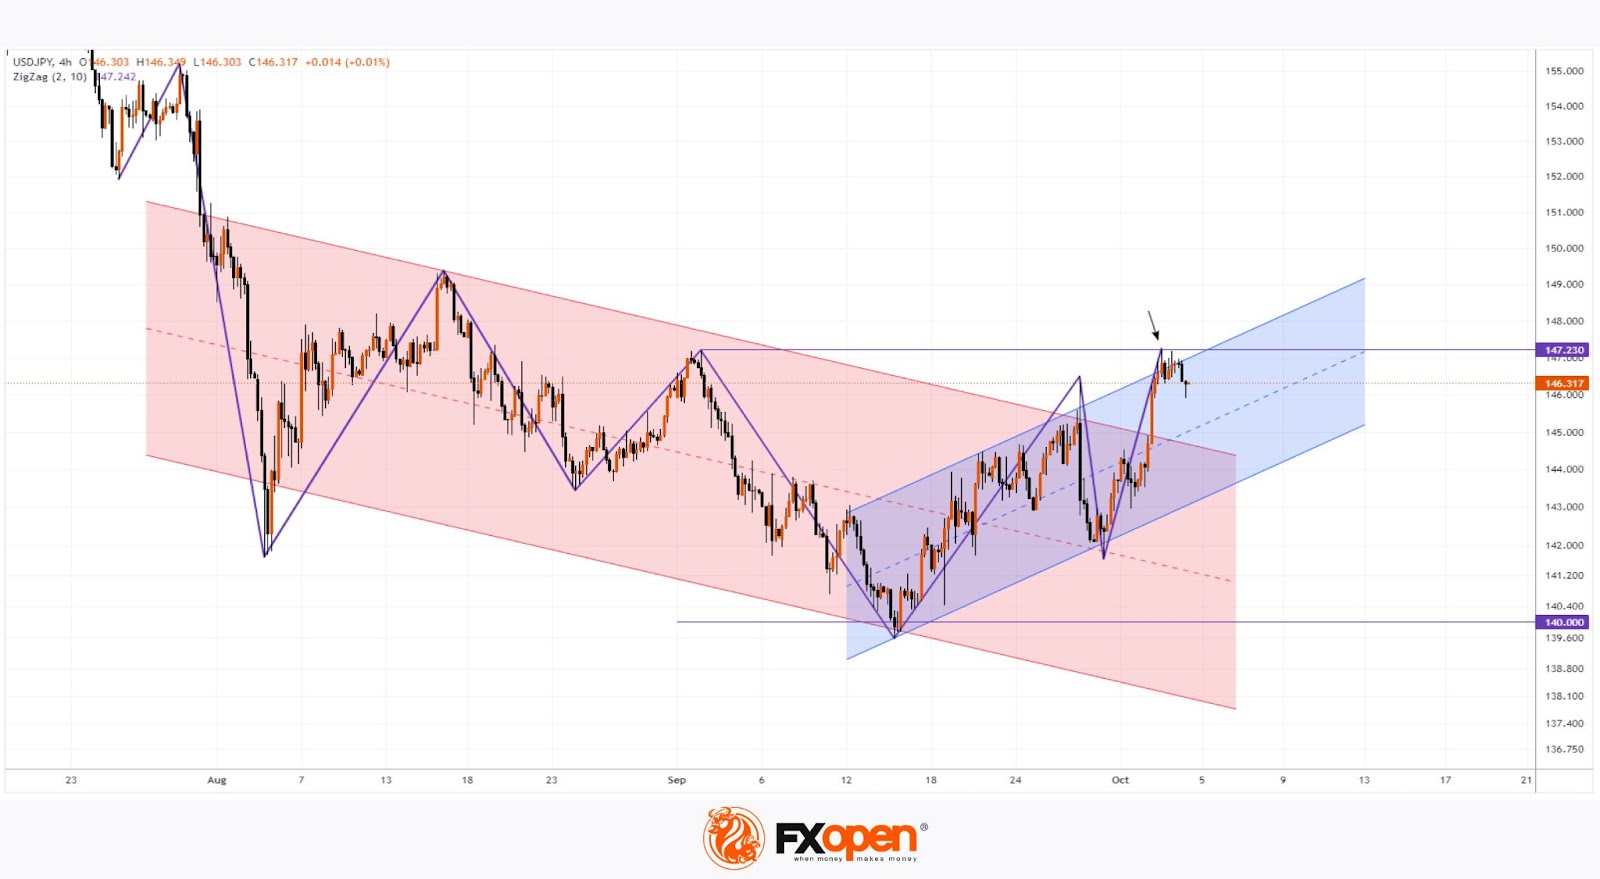
The USD/JPY chart shows that yesterday (3 October), the price slightly surpassed the 147.230 level, marking the highest point since 3 September.
This is significant as it indicates a new swing high, identified by the ZigZag indicator (in purple), which hasn’t been seen in months.
Bullish arguments for the USD/JPY chart today:
→ The price is within an ascending channel (shown in blue), illustrating an upward trajectory for the US dollar. This follows a period where the yen gained strength, pushing the exchange rate below the psychological threshold of 140 yen per dollar.
→ After the price broke above the upper boundary of the blue channel (signifying overbought conditions), a correction (such as to the channel's median) appears appropriate.
Bearish argument:
→ The brief breach above the prior swing high (indicated by an arrow) may have created a bull trap and triggered stop-losses for sellers positioned just above the 3 September high. Today’s decline supports the view that the break above 147.230 was a false breakout.
What’s next for USD/JPY?
Much will depend on the fundamentals.
On Friday, traders are closely watching US labour market data (to be released at 15:30 GMT+3), which could influence US interest rate expectations. Meanwhile, the yen's movement is affected by uncertainties surrounding Japan’s upcoming prime ministerial change. According to Reuters, recent comments from Shigeru Ishiba have fuelled expectations that Japan's rate hikes might be delayed.
Additionally, demand for safe-haven assets is impacting USD/JPY as markets assess the effects of rising tensions in the Middle East on the global economy.
Trade over 50 forex markets 24 hours a day with FXOpen. Take advantage of low commissions, deep liquidity, and spreads from 0.0 pips (additional fees may apply). Open your FXOpen account now or learn more about trading forex with FXOpen.
This article represents the opinion of the Companies operating under the FXOpen brand only. It is not to be construed as an offer, solicitation, or recommendation with respect to products and services provided by the Companies operating under the FXOpen brand, nor is it to be considered financial advice.
Stay ahead of the market!
Subscribe now to our mailing list and receive the latest market news and insights delivered directly to your inbox.


Latest articles

AUD/CAD: Months of Indecision — Is a Breakout Finally Coming?
The Australian dollar has clawed back most of its end-of-June losses, when it touched three-month lows against the greenback amid escalating Middle East tensions. Since then, sentiment has improved: the RBA's Assistant Governor Sarah Hunter signalled the board stands ready

USD/JPY: Battling at the Top of the Triangle
On 3 July, Japan's Finance Minister, Satsuki Katayama, stated that the Ministry of Finance remains in close contact with US authorities regarding developments in USD/JPY as the yen traded near its weakest level in almost 40 years. Similar verbal

Dow Jones (DJIA): Consolidation Beyond the Trend
Federal Reserve Chair Kevin Warsh testified before Congress on 14–15 July, reaffirming the Fed's commitment to bringing inflation back to target while providing no clear guidance on the future path of interest rates. Meanwhile, June inflation data came in