


FXOpen

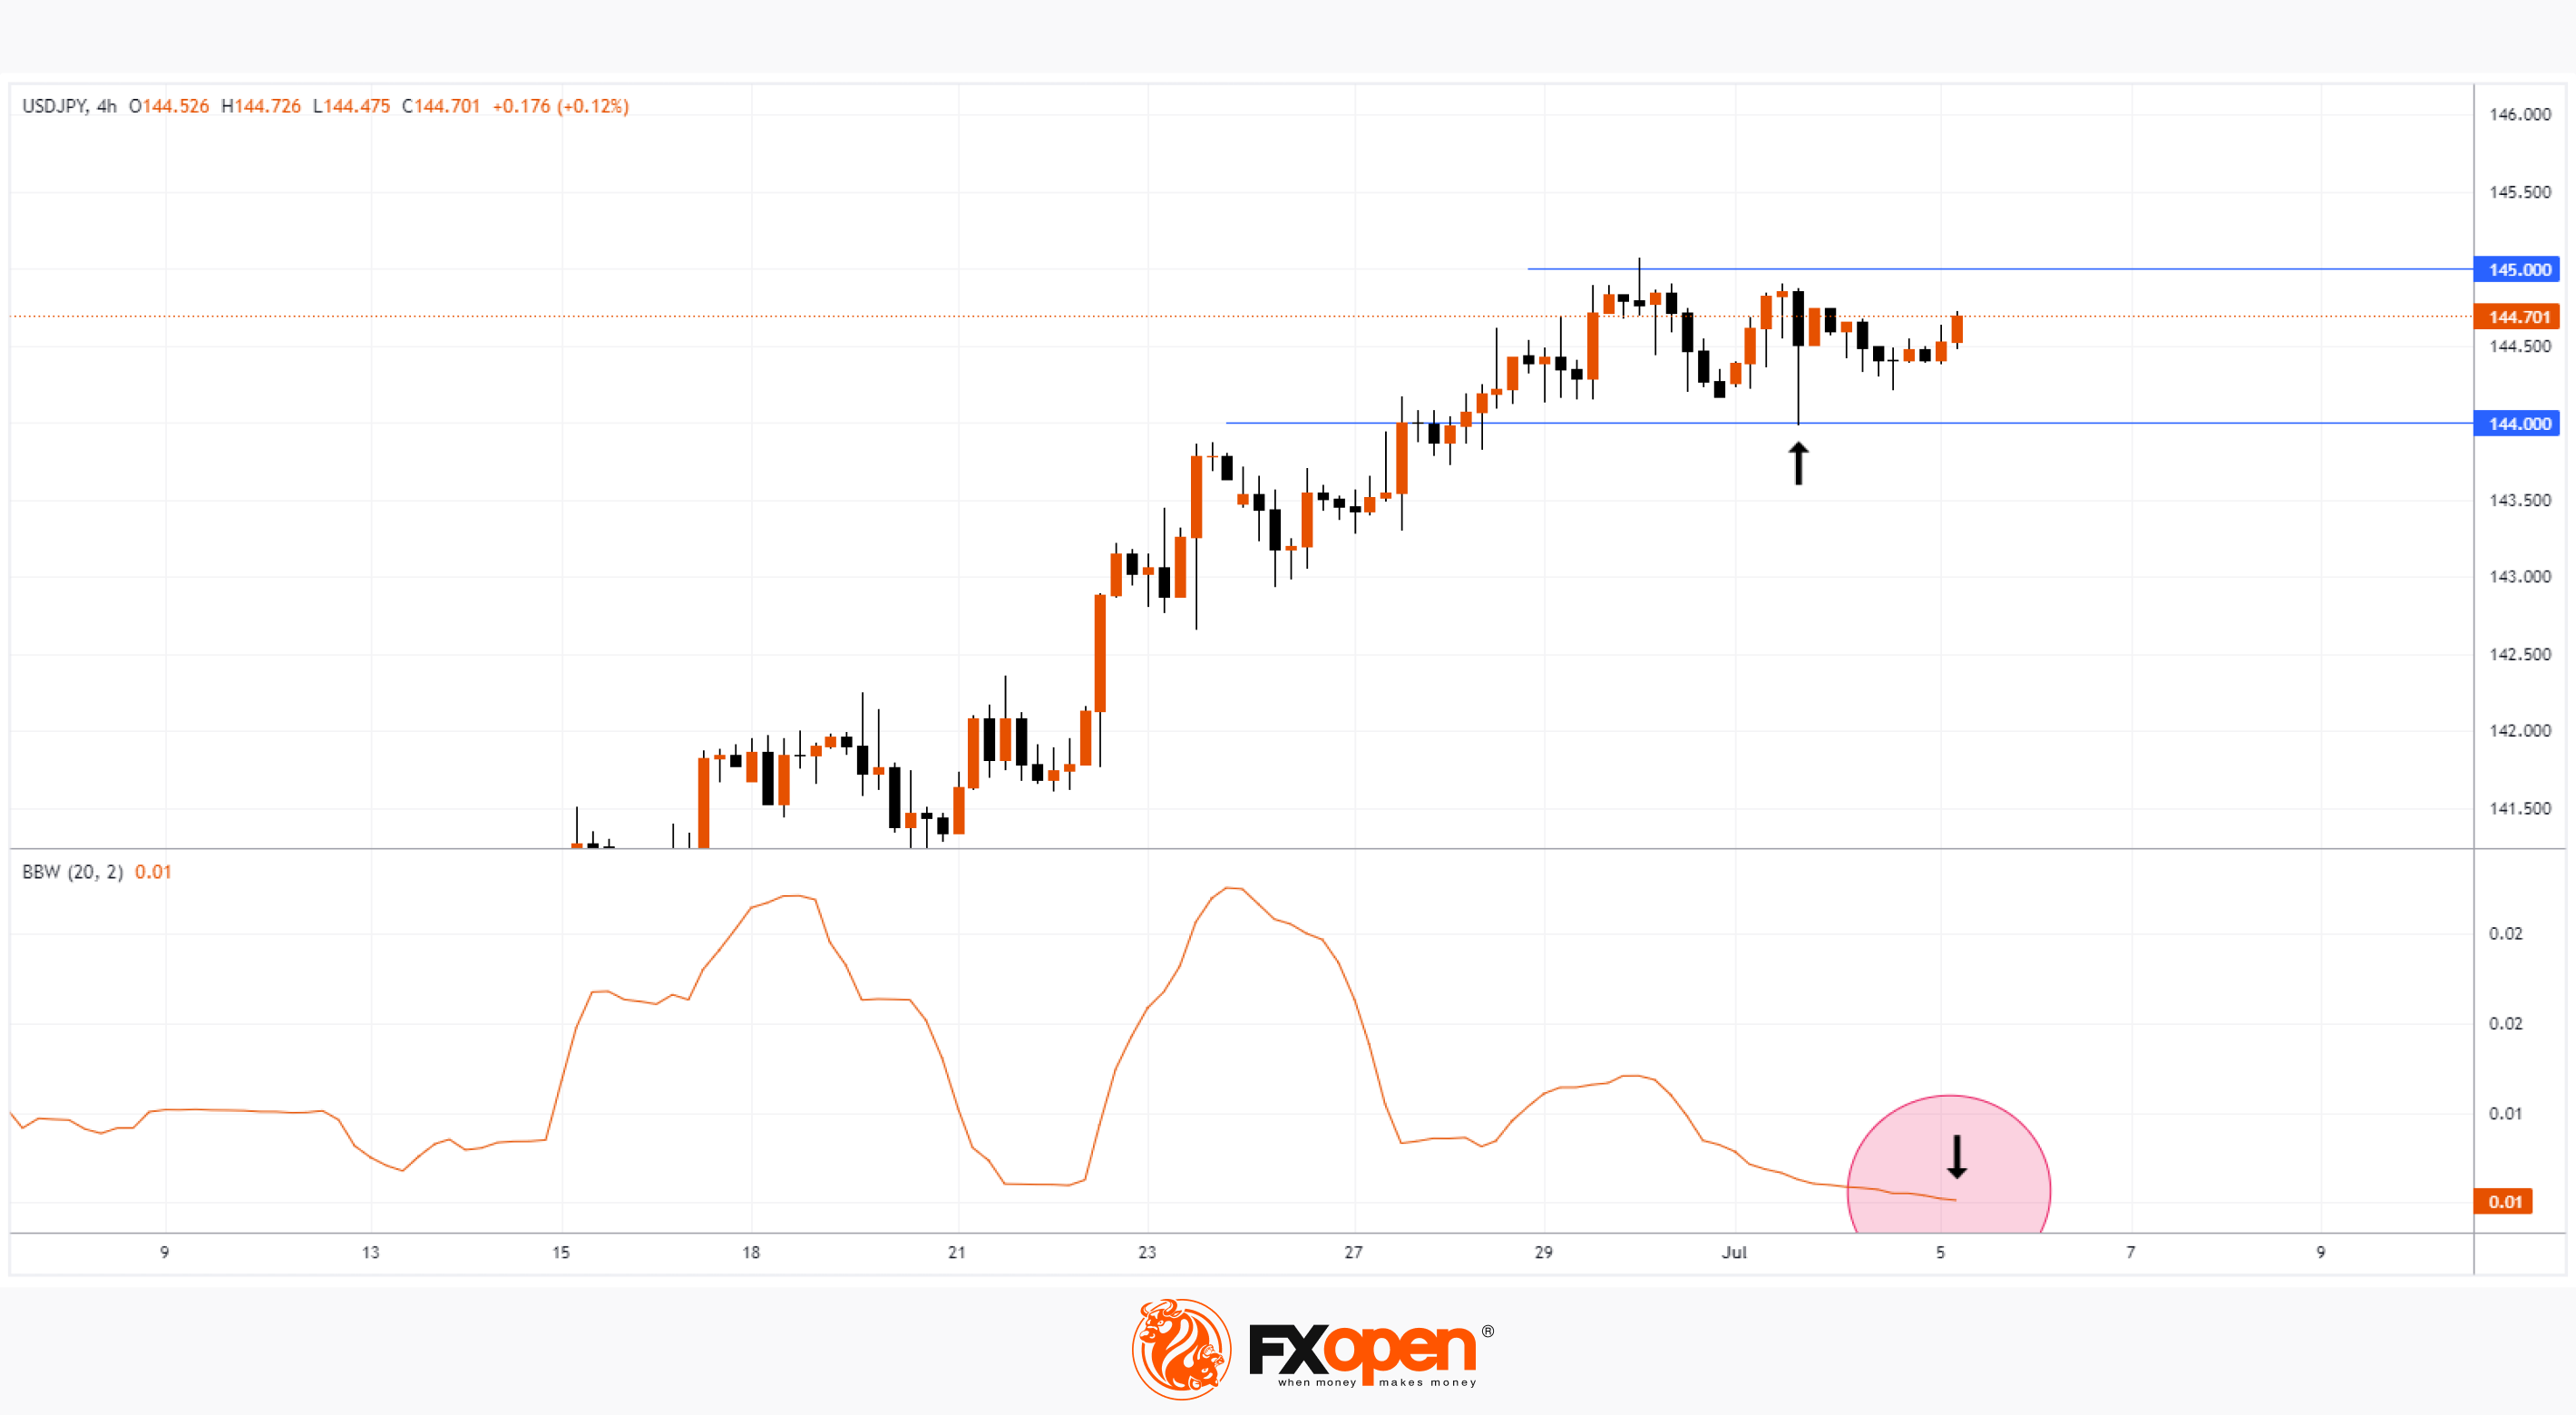
There is some lull (consolidation) in the USD/JPY market, which is evidenced by the width of the Bollinger bands, which dropped to the lows of the end of February on the 4-hour chart. Bank holidays in the US in connection with the celebration of Independence Day contributed to the decrease in volatility.
However, the calm could be replaced by a storm.
The USD/JPY chart shows that the bulls have tested the level of 144 and on the morning of July 5, the rate is gradually rising towards the level of 145 — technically this can be interpreted as a demand force for dollars.
Reuters reports the words of Shusuke Yamada, chief forex strategist at Bank of China, who believes that the market expects further weakening of the yen in the medium term. And this is important, because last fall, the level of 145 yen per US dollar was the trigger for intervention by the Bank of Japan.
Add here the news from the FOMC, which will be released today at 21:00 GMT+3, and you will get a set of drivers that can cause a surge in market volatility in July and an expansion of Bollinger bands.
Trade over 50 forex markets 24 hours a day with FXOpen. Take advantage of low commissions, deep liquidity, and spreads from 0.0 pips (additional fees may apply). Open your FXOpen account now or learn more about trading forex with FXOpen.
This article represents the opinion of the Companies operating under the FXOpen brand only. It is not to be construed as an offer, solicitation, or recommendation with respect to products and services provided by the Companies operating under the FXOpen brand, nor is it to be considered financial advice.
Stay ahead of the market!
Subscribe now to our mailing list and receive the latest market news and insights delivered directly to your inbox.


Latest articles

Market Insights with Gary Thomson: Where Are Oil, Gas & Global Indices Heading?
In this video, we’ll explore the key economic events and market trends, shaping the financial landscape. Get ready for insights into financial markets to help you navigate the week ahead. Let’s dive in!
In this episode of Market

Netflix (NFLX) Shares Pull Back After a 30% Surge
On 21 January, while analysing the NFLX chart, we:
→ identified a descending channel and a resistance zone around the $100 level;
→ noted that Netflix shares were showing a sustained downtrend. Selling pressure had been triggered primarily by reports of a

US Dollar Index (DXY) Rises Above the 100 Level
Today the US Dollar Index (DXY) climbed above the psychological 100 mark for the first time in 2026, supported by a tense fundamental backdrop, with the military conflict in the Middle East acting as the main driver.
→ Financial market participants