


FXOpen

The long-awaited event — the Fed’s first rate cut of 2025 — has taken place. What is particularly important to note is the price action on the US Dollar Index (DXY) chart.
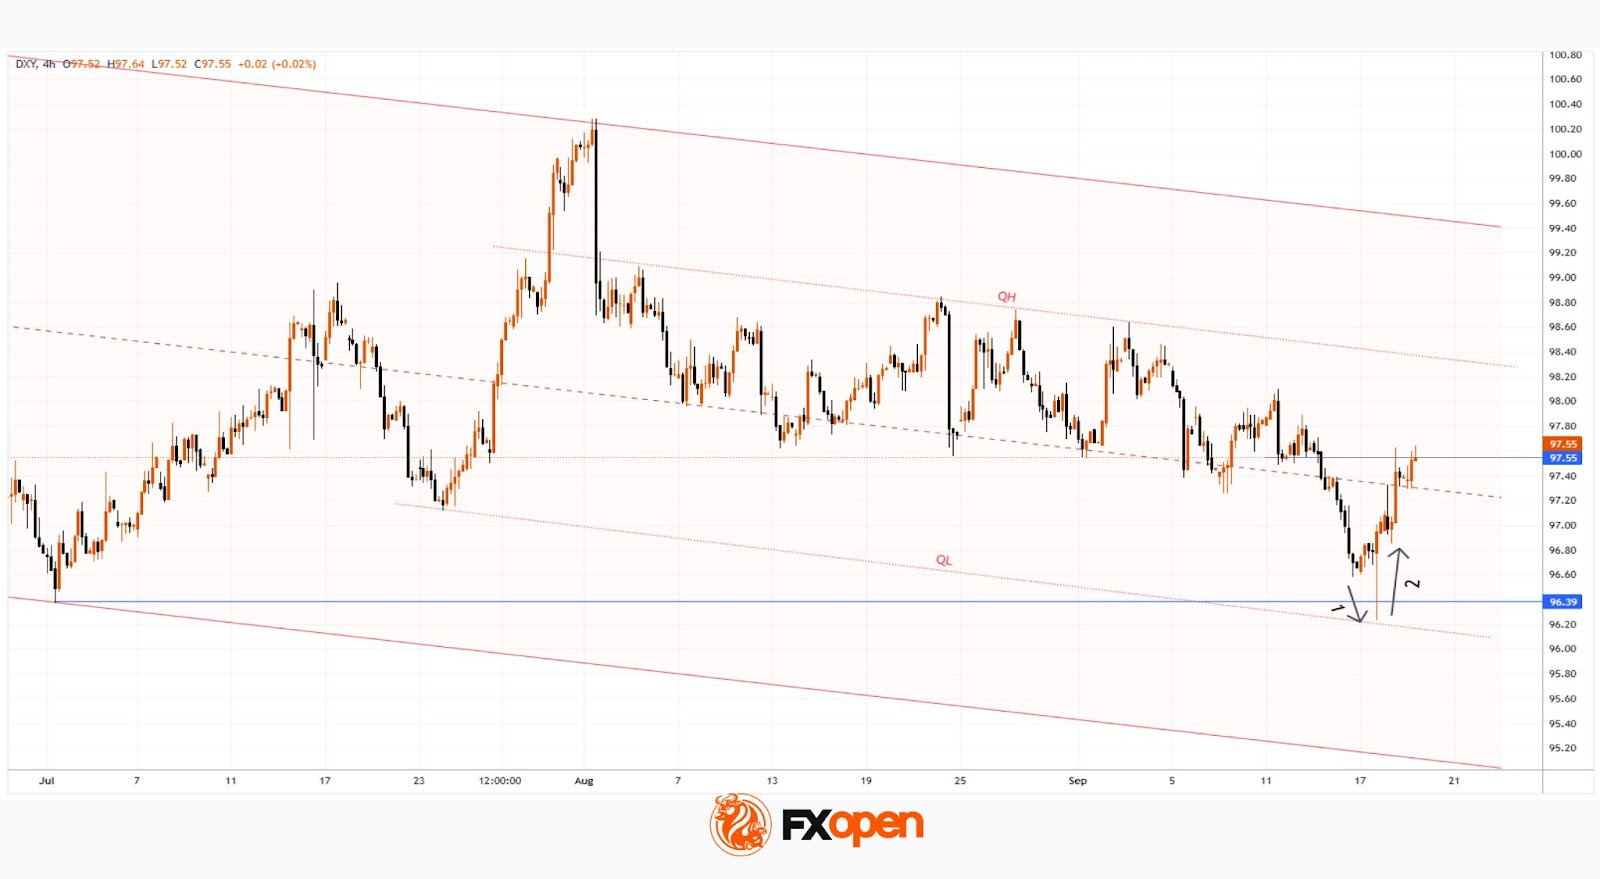
The value of the USD against a basket of other currencies made a two-step move, forming a pin-bar candle with a long lower shadow:
→ Arrow 1: When the Fed actually announced the easing, the dollar weakened as expected on this “dovish news.”
→ Arrow 2: But at the subsequent press conference, Fed Chair Jerome Powell delivered a series of “hawkish” remarks that shifted the market mood and drove the dollar higher. He stressed that this cut does not mark the beginning of “a series of continuous rate reductions,” and that further decisions will be taken “based on incoming economic data.”
Powell also stated plainly that the option of a more aggressive 50-basis-point cut had not gained sufficient support among FOMC members. Therefore, the “down-then-up” move highlights a sharp change in trader sentiment within a short timeframe, as expectations failed to materialise.
Technical Analysis of the DXY Chart
In our 9 September analysis, we confirmed the relevance of:
→ the descending channel (shown in red) defined by a sequence of lower highs and lower lows;
→ the intermediate QL and QH lines, which divide the channel into quarters.
Notably, at Wednesday’s low the price:
→ touched the QL line, underscoring its strength;
→ formed a clear Liquidity Grab pattern (in the terminology of the Smart Money Concept methodology).
From the perspective of Richard Wyckoff’s method, Wednesday’s low may be viewed as a Spring pattern, which preceded a Mark-Up phase of rising prices.
How Might Events Unfold Next?
Given the above, we could assume that the hawkish tone could serve as a longer-term factor for the DXY index. The 97.55 level appears to act as resistance, but it is possible that we may see an attempt to break through it, with the next target being the QH line.
Trade global index CFDs with zero commission and tight spreads (additional fees may apply). Open your FXOpen account now or learn more about trading index CFDs with FXOpen.
This article represents the opinion of the Companies operating under the FXOpen brand only. It is not to be construed as an offer, solicitation, or recommendation with respect to products and services provided by the Companies operating under the FXOpen brand, nor is it to be considered financial advice.
Stay ahead of the market!
Subscribe now to our mailing list and receive the latest market news and insights delivered directly to your inbox.


Latest articles

Consolidation Ahead of NFP: Commodity Currencies Search for Direction
Commodity-linked currencies have entered a consolidation phase following recent directional moves, as market participants adopt a wait-and-see approach ahead of key US labour market data. Current price action reflects a balance between ongoing demand for the US dollar and attempts

The Real Driver Behind the Dollar Rally: Market Insights with Gary Thomson
The US dollar has been firm, but the drivers behind the move may be more complex than they first appear.
While geopolitical tension and shifts in risk sentiment play a role, current price behaviour seems increasingly influenced by inflation expectations

EUR/USD and USD/CHF Pull Back: Market Reacts to Fundamentals
European currencies have shown a recovery in recent trading sessions after their recent decline, displaying early signs of a reversal. The US dollar is weakening amid expectations surrounding upcoming US macroeconomic data, while market participants are reassessing their short-term positions