


Wyckoff Trading Explained: Cycles, Schematics, and Strategy
FXOpen
The Wyckoff method is a technical analysis framework developed by Richard D. Wyckoff in the early 20th century. It focuses on analysing price and volume to identify institutional activity and market cycles.
The method is based on the idea that large market participants drive trends through accumulation and distribution phases. Traders use this approach to anticipate price movements and identify potential entry and exit points.
This article explains the core principles of the Wyckoff trading method, including its laws, market cycle, and application in modern Wyckoff trading strategies.
Wyckoff Method Explained (Quick Summary)
- The Wyckoff method is a price and volume-based trading framework
- It was developed by Richard D. Wyckoff in the early 1900s
- It focuses on institutional behaviour, often referred to as “smart money”
- The model includes four phases: accumulation, markup, distribution, and markdown
- Traders use Wyckoff schematics to identify potential reversals and trend continuation
- The method is applied across forex, stocks, commodities, and crypto* markets
What Is the Wyckoff Method in Technical Analysis?
The Wyckoff method is a type of technical analysis developed in the early 20th century by Richard D. Wyckoff, a renowned stock market trader and analyst. The method assumes markets are driven by supply and demand, which form repeatable and tradable price patterns.
The Wyckoff methodology provides a structured framework for building trading strategies based on price and volume behaviour. This system includes the relationship between price and volume, the identification of Wyckoff market structure, and the role liquidity plays in financial markets.
The Wyckoff method remains widely referenced in modern technical analysis and institutional trading frameworks. Its principles are closely aligned with price–volume analysis and market structure concepts used across global financial markets.
Why the Wyckoff Model Works
Large financial institutions need liquidity to execute sizeable orders without excessive slippage. To fill these orders, they require counterparties on the other side of the trade.
Liquidity clusters around predictable levels: above equal highs, below equal lows, beyond trendlines, and at support and resistance zones. Stop-loss orders and breakout entries sit at these levels in high concentration. Institutions target these pools because they provide the volume needed to absorb large positions at favourable prices.
By driving prices through these key levels, institutional participants trigger stops and breakout orders, generating the liquidity they need to build or offload positions. This mechanism of liquidity engineering, driven by institutional trading activity, is the fundamental idea behind the Wyckoff theory in forex, commodities, crypto*, stocks, and more.
Key Principles of Richard D. Wyckoff Method
There are a few fundamental principles of the Wyckoff methodology that are critical to your understanding: the Composite Man and the three laws.
Composite Man
The Composite Man represents a single dominant market operator whose actions traders analyse to interpret price movements. He is, in essence, the representation of smart money trading activity. Wyckoff believed that the Composite Man carefully plans and executes his trades, encouraging buyers (or sellers) only after he has accumulated a sizable position.
The Law of Supply and Demand
Simply put, if the demand for an asset is larger than its supply, prices will rise. On the other hand, if the supply of an asset is larger than its demand, prices will decrease.
The Law of Cause and Effect
This law states that Wyckoff events, such as accumulation and distribution, act as causes that drive future price movements. It also says that the effect, or the price movements, are proportional to the cause. An accumulation that occurs on the daily timeframe will produce a much more significant effect than one on the 1 minute, for instance.
The Law of Effort vs Results
This law says that price movements are a result of effort, characterised by volume. If a bullish trend is supported by strong volume, it will likely continue. High volume within a range, without price progress, may indicate weakening momentum and a potential trend reversal.
Wyckoff Market Cycle: Accumulation, Markup, Distribution, Markdown
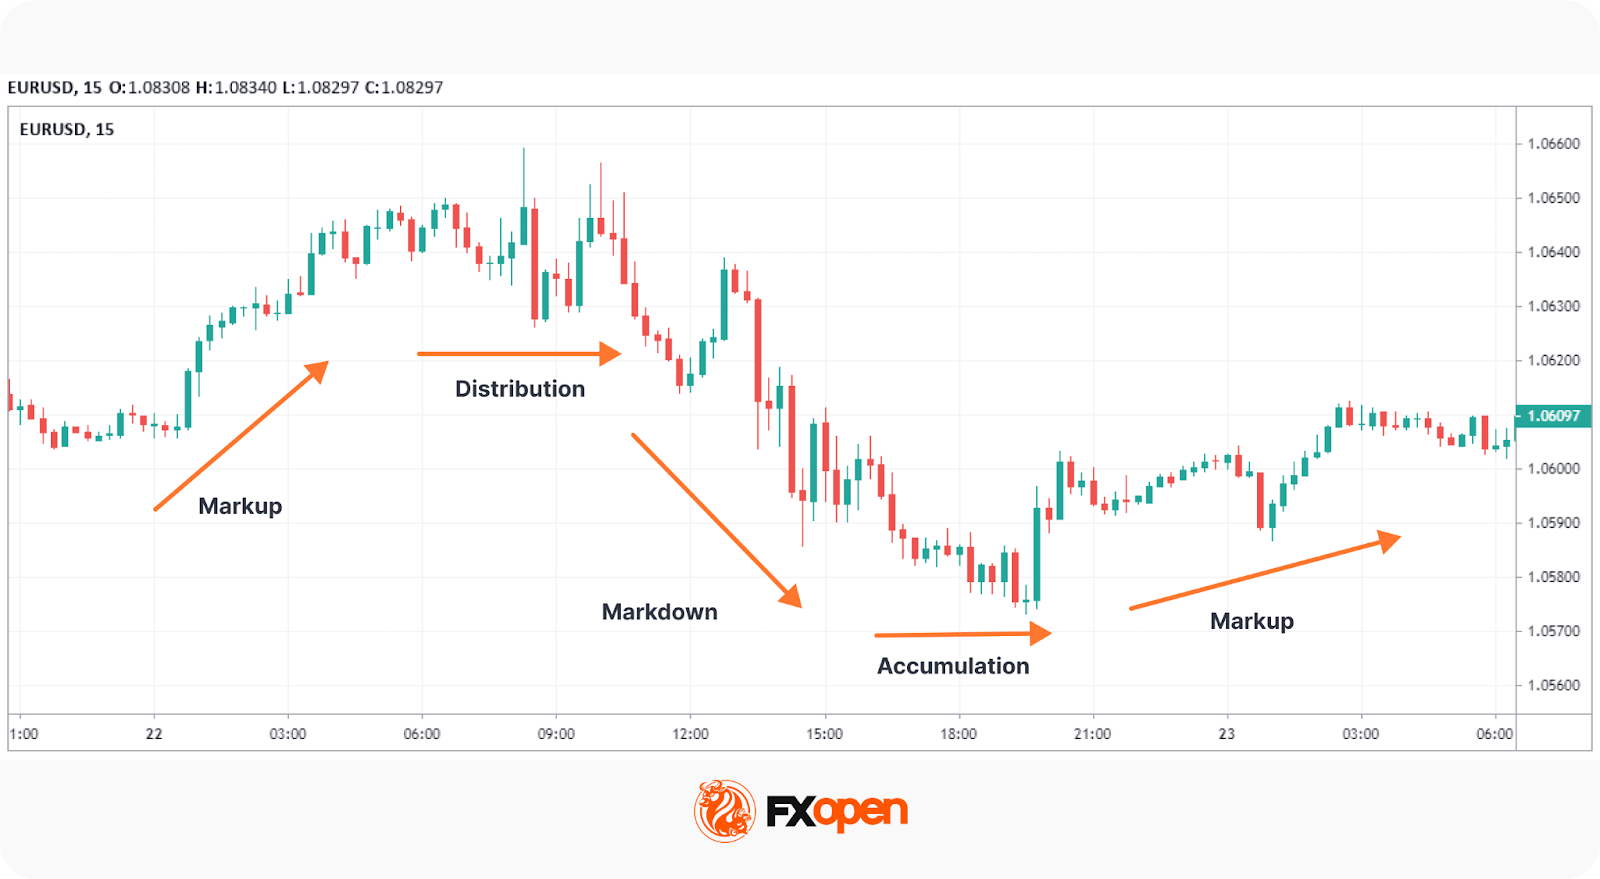
The Wyckoff methodology frames the markets in four repeated phases. These are accumulations, markups, distributions, and markdowns.
Accumulations
Most often seen in ranges, the Wyckoff accumulation pattern represents areas where large players are building up a position to go long before the market reveals its true direction to other traders.
Markups
Once they hold a large enough position, these players start to bid the price up, encouraging other traders to jump in and push the price up further. Increasing participation reinforces upward momentum, pushing price out of the range and initiating a sustained uptrend. Note that a markup may have multiple re-accumulations where it pauses and consolidates before breaking higher.
Distributions
Once the price reaches its target and the buying pressure from other traders subsides, the big players will begin to distribute (sell) their positions while building up shorts. This Wyckoff distribution will, again, look like a range before a sharp move down.
Markdowns
This sharp move down is known as the markdown. It’s essentially the opposite of a markup: financial institutions push the price down and encourage traders to enter short positions to begin a downtrend. Like markups, there are also phases of redistribution that consolidate before moving lower.
How Traders Apply the Wyckoff Method Today
While the core principles remain unchanged, traders have adapted the Wyckoff methodology to suit modern markets and tools. Here are the most common applications:
- Market structure identification: Traders use Wyckoff schematics to label live price action, mapping accumulation and distribution phases across forex, equities, and commodities.
- Wyckoff volume profile integration: Modern charting platforms allow traders to overlay volume profiles onto Wyckoff ranges, pinpointing where the heaviest activity occurred.
- Multi-timeframe confirmation: Many traders identify a Wyckoff phase on higher timeframes (e.g., daily), then drop to lower timeframes (e.g., 1-hour). This may help to refine entries around Springs, Tests, or LPS zones.
- Confluence with other tools: The Wyckoff method is frequently combined with order flow data, support/resistance levels, and indicators like the RSI to add confirmation layers.
- Algorithmic detection: Some institutional and retail traders use algorithms to scan for Wyckoff-like structures across multiple instruments simultaneously.
Wyckoff Schematics Explained: Accumulation and Distribution Patterns
These cycles can be identified using standard Wyckoff chart patterns based on price and volume behaviour. If you want to test your own understanding, you may use the TickTrader platform with us at FXOpen.
Note that Wyckoff accumulations and distributions are practically identical, just flipped upside down. The key concepts, points, and phases across Wyckoff schematics are all the same.
Type 1 Schematics
Wyckoff Accumulation Schematic
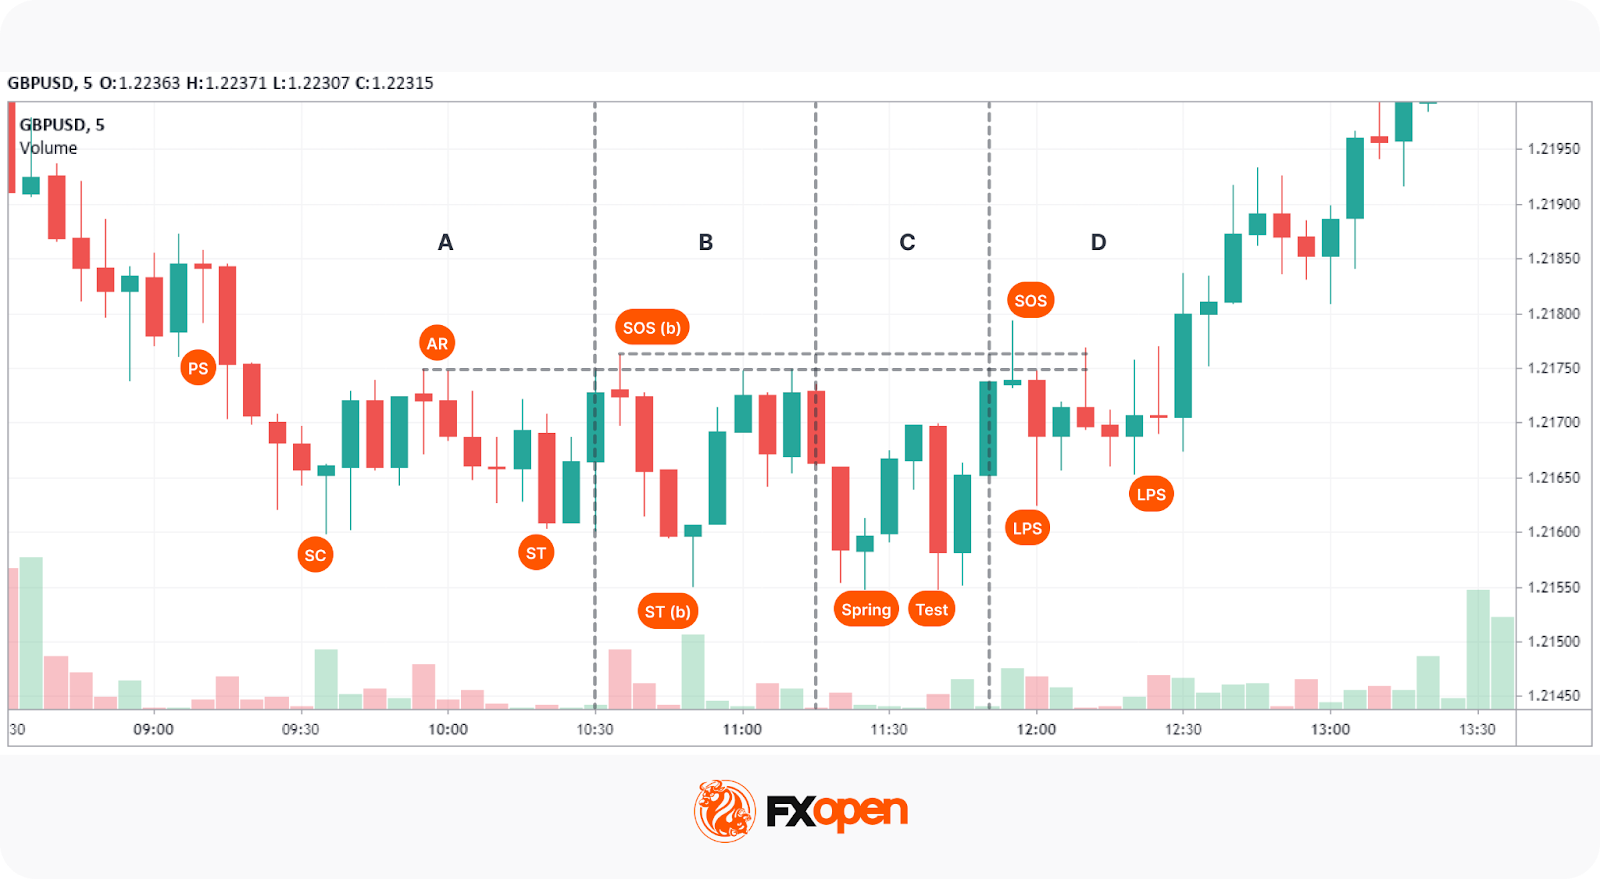
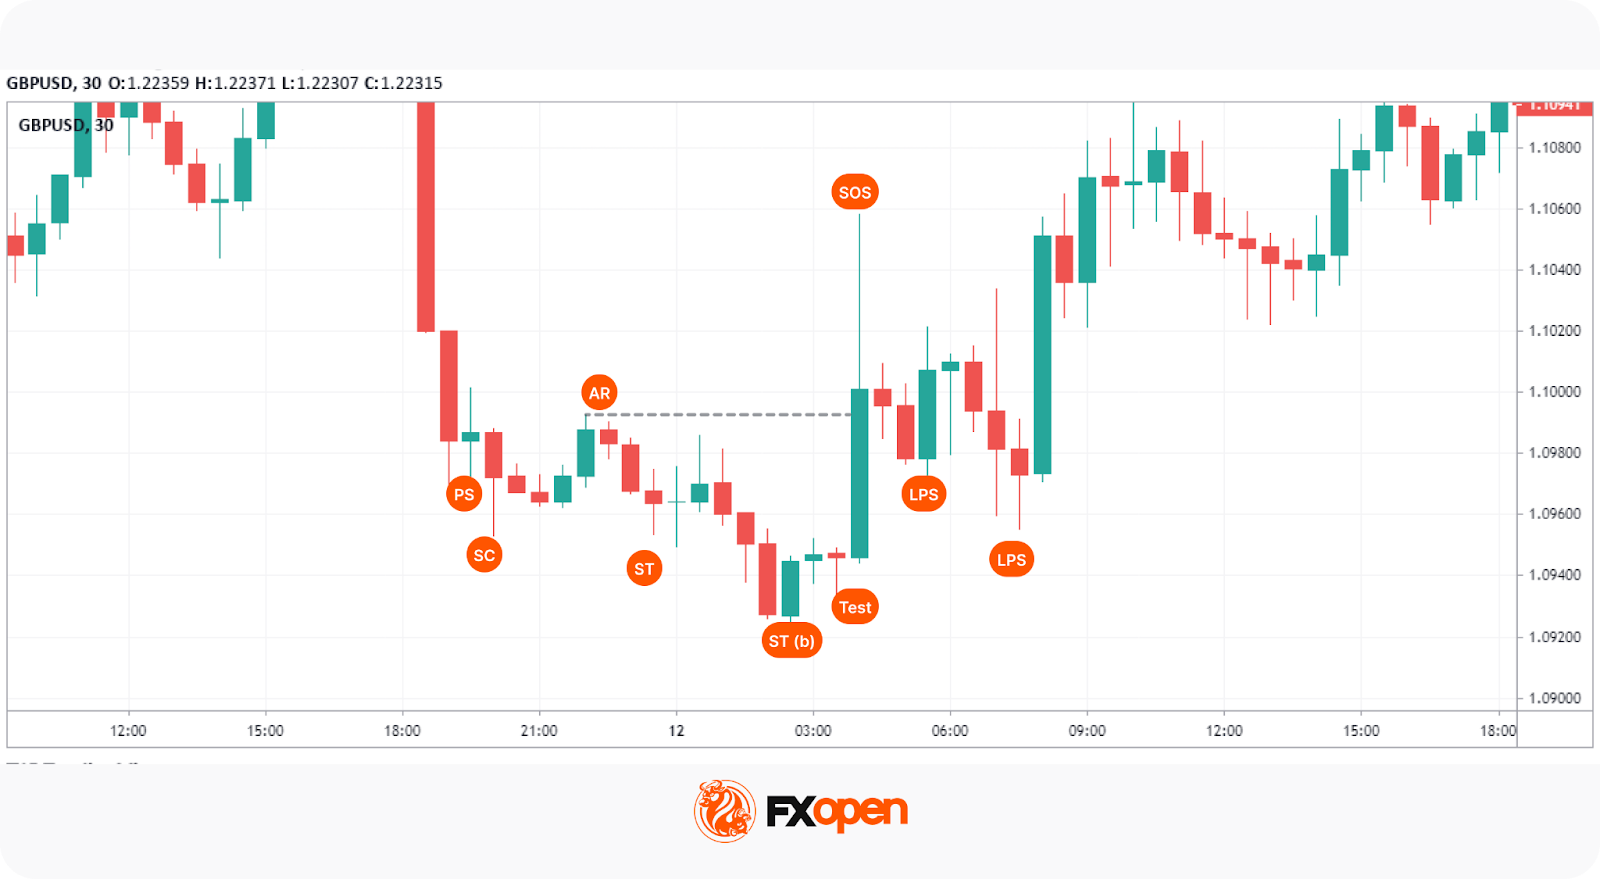
Phase A
- Preliminary Support (PS): After a markdown, buying action interrupts the downtrend and causes a slight uptick in price. Volume increases.
- Selling Climax (SC): Long traders have their stop losses triggered, while breakout traders jump in short, believing the downtrend will continue. Here, the Composite Man absorbs the selling pressure. The SC may sometimes leave a long wick that shows the buying pressure.
- Automatic Rally (AR): Given that selling pressure is exhausted, buy orders push prices up easily, and shorts exit their trades, typically below PS. Note that the high of the AR sets the first upper bound for the accumulation, as seen in the Wyckoff accumulation examples above.
- Secondary Test (ST): The price falls from the AR to form a low near the SC, creating the ST. It can create equal lows or end up slightly higher or lower than the SC. This may also occur multiple times, creating a visual area of support. Volume is likely to be low.
Phase B
- Sign of Strength in Phase B (SOS(b)): After the ST, the price can rebound higher than the AR, forming the SOS(b). This won’t always occur, but if it does, it creates our second upper bound. Again, it is supposed to fall below the PS.
- Secondary Test in Phase B (ST(b)): This is the first “liquidation” event of the accumulation. A sharp move downward takes out the ST and, ideally, the SC. Here, the Composite Man taps into the stop losses below the ST and breakout sell orders to fill his buy orders, creating the Cause.
Phase C
- Spring: Following the ST(b), the price will likely test the first and second upper bounds, but it is supposed to always stay within them. After doing so, the Composite Man will push the price down for the last time below the ST(b), liquidating any orders resting below here to form the Spring.
- Test: After creating the Spring, the Composite Man will often test the area to see if there’s any supply left. The price will make a higher low near the Spring, often with a lower volume. Note that there can be multiple tests.
Phase D
- Last Point of Support (LPS): Following the test and another leg higher, the price will pull back to test supply once again. LPSs are usually much higher than the initial Tests and are often the last move before the markup begins. LPSs can form both before and after the SOS, depending on how the price action plays out.
- Sign of Strength (SOS): Here, the price breaks above the highest upper bound and confirms the schematic, often with higher volume. As mentioned, the LPS can form after the breakout and fall back in the range or test the upper resistance line. After the SOS forms, the markup begins and produces the Effect as seen in the Wyckoff accumulation chart above.
Wyckoff Distribution Schematics
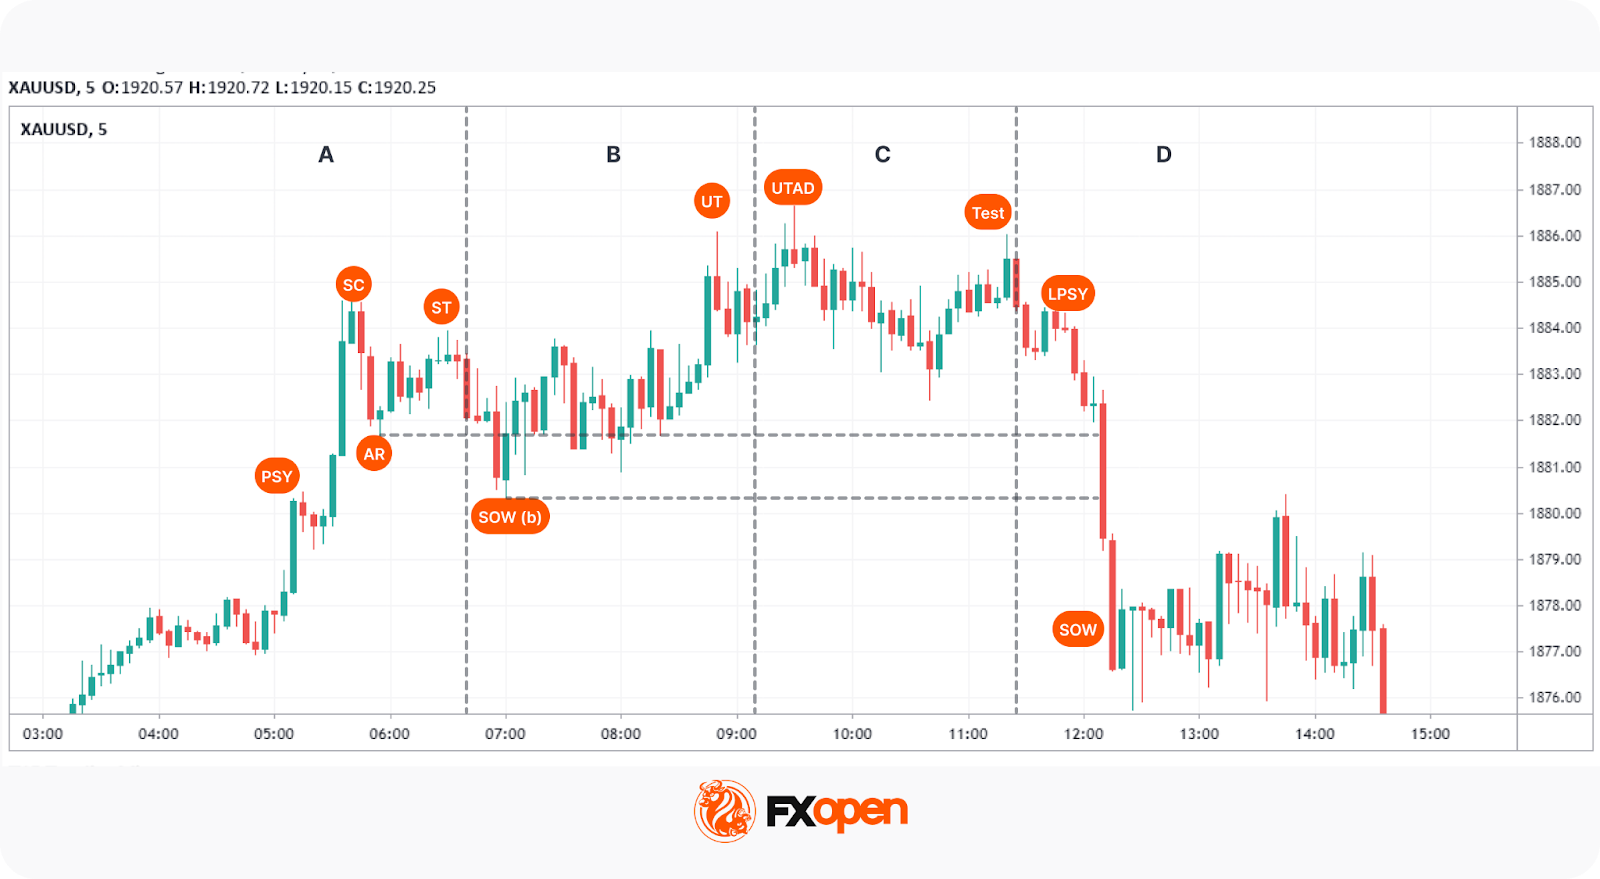
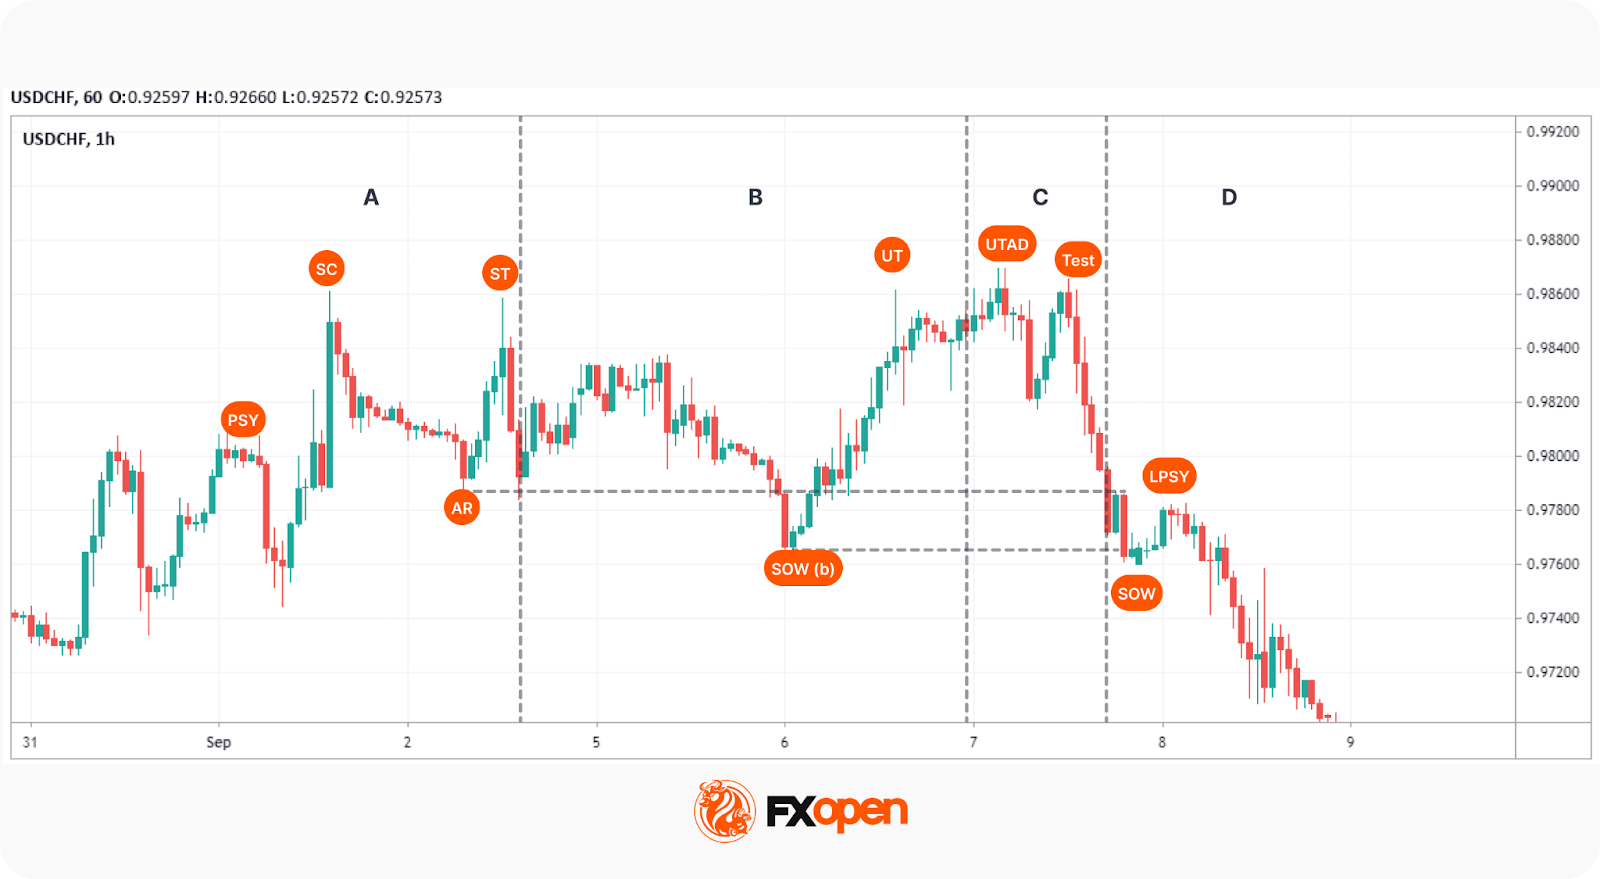
Phase A
- Preliminary Supply (PSY): After an uptrend, the Composite Man begins to unload his position, causing the price to fall slightly.
- Buying Climax (BC): Like the SC, the BC is where buying pressure is at its most extreme, coinciding with high volume.
- Automatic Rally (AR): After buying subsidies, prices fall to form the AR, usually above the PSY. This is our first lower bound, shown in the Wyckoff distribution examples.
- Secondary Test (ST): The price revisits the BC area to create another high usually below the BC, building up liquidity for future phases. The volume should be low.
Phase B
- Sign of Weakness in Phase B (SOW(b)): A move down past the AR that indicates supply is entering the market. Like the SOS(b), the SOW(b) doesn’t always occur, but if it does, it forms our second lower bound.
- Upthrust (UT): This is the distribution equivalent of an ST(b). It must reach higher than the ST and may take out the BC. Here, the Composite Man uses short stop losses and breakout trades to fill his sell orders.
Phase C
- Upthrust After Distribution (UTAD): The UTAD is analogous to an accumulation’s Spring. Following the UT, one last tap into areas of liquidity is made before the markdown.
- Test: Similar to accumulation, there are usually one or more tests made near the UTAD attempting to see if any demand remains.
Phase D
- Last Point of Supply (LPSY): After the price declines, the final demand tests are made. Like accumulations, these points can occur before or after the Sign of Weakness. They’re typically the last bullish moves made before the markdown begins.
- Sign of Weakness (SOW): The lowest bound is broken as the price begins to confirm its bearish structure. Another LPSY can be made, but this is the final step before the markdown.
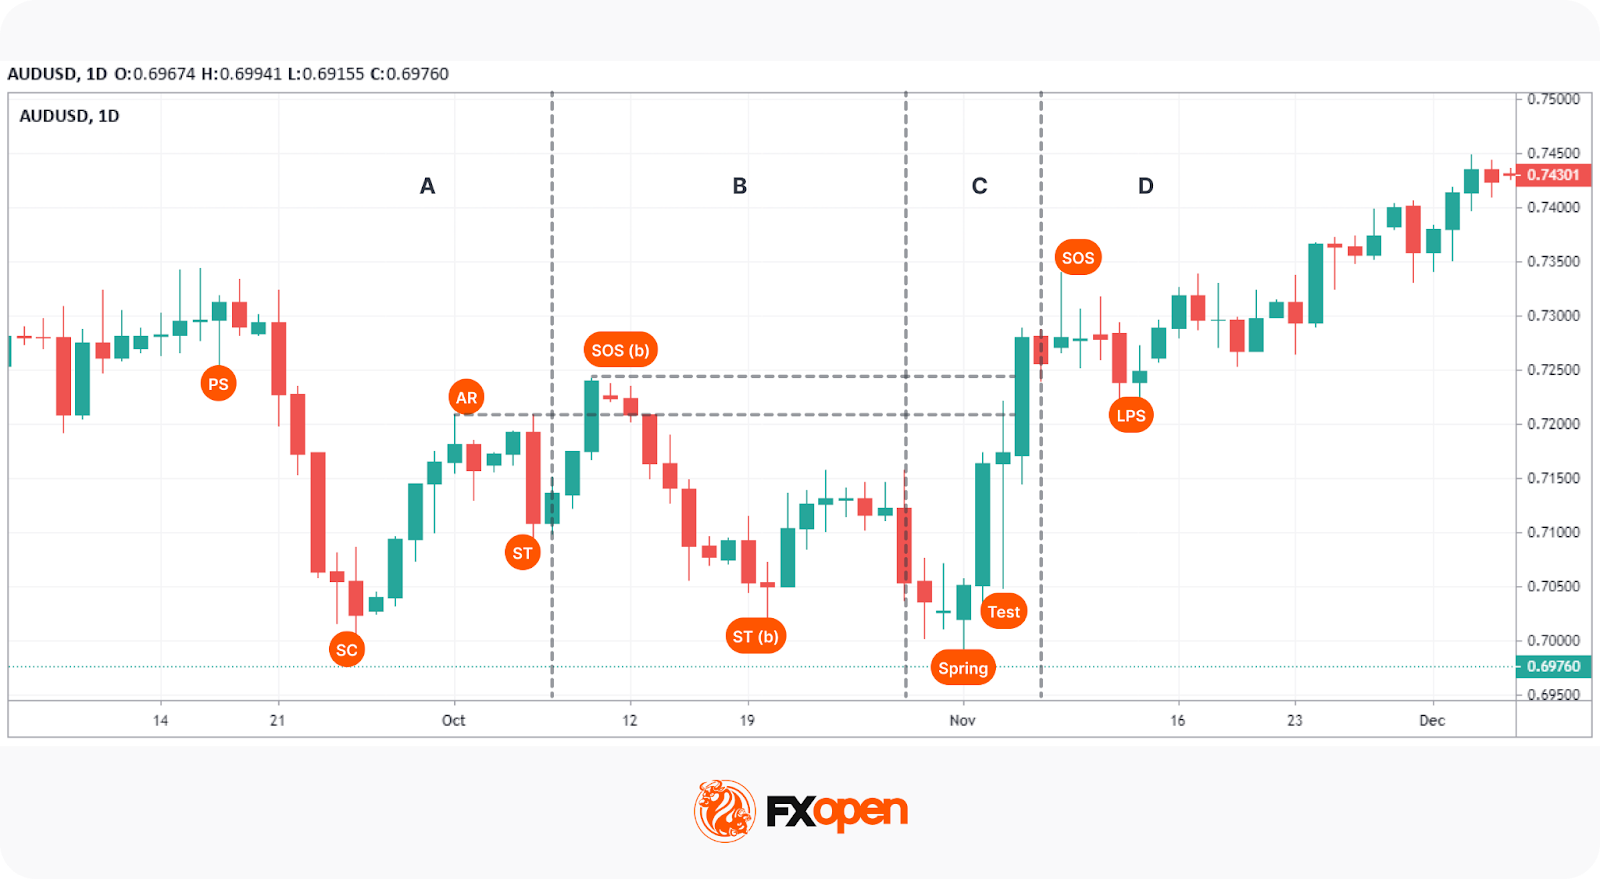
Type 2 Schematics
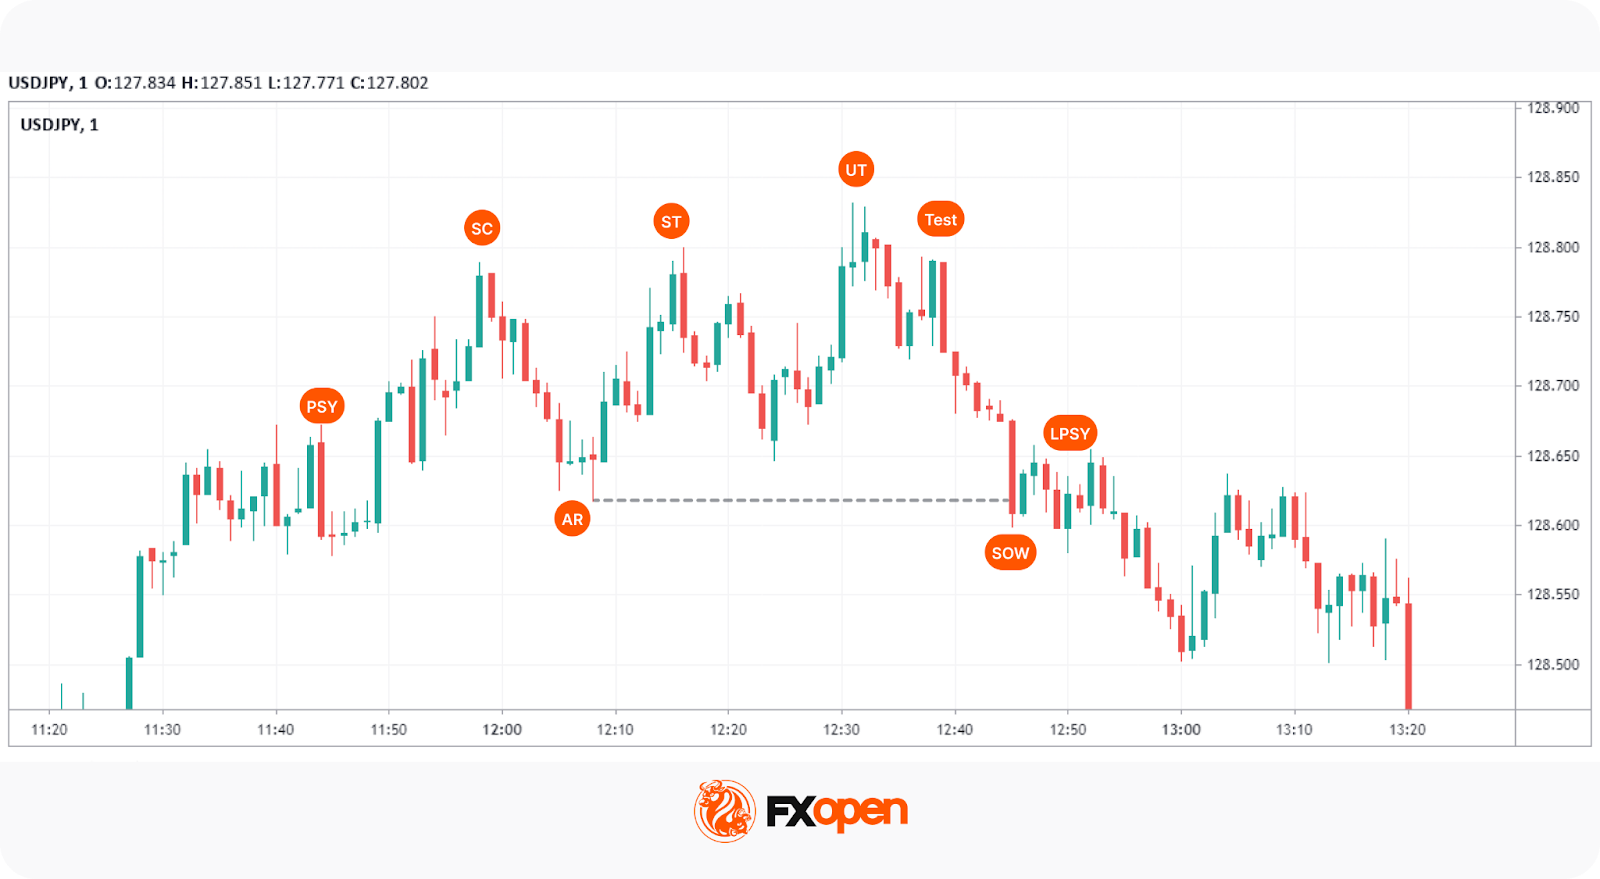
Type 2 Wyckoff schematics have all of the same ingredients, just without a Spring or UTAD. Wait for the SOS or SOW to occur. If you have just a single ST and an ST(b), or an ST and UT, and the markup or markdown begins, you know it’s a Type 2. This is seen in the Wyckoff graph above. Both can be traded in the same ways as a Type 1.
Wyckoff Trading: Pros and Cons
The Wyckoff trading method offers a systematic approach to analysing market trends and making trading decisions. Like any trading strategy, it comes with its advantages and disadvantages that traders often consider.
Pros
- Structured Framework: The Wyckoff method provides a clear framework for identifying market phases, supporting traders when building entry or exit strategies.
- Focus on Market Psychology: It emphasises understanding the behaviour of the "Composite Man," which can offer insights into market sentiment and potential moves.
- Versatility: The Wyckoff strategy can be applied across various markets, including forex, stocks, commodities, and cryptocurrencies*.
- Incorporates Volume Analysis: Analysing volume in relation to price action may help traders to gauge the strength of trends and potential reversals.
Cons
- Complexity: The Wyckoff trading method requires a deep understanding of market mechanics and chart patterns, which may be challenging for beginners.
- Requires Patience: Identifying the correct phase of a Wyckoff accumulation or distribution can take time, and trades may require waiting for confirmation signals.
- Subjective Interpretation: Like many technical analysis tools, the Wyckoff method depends on the trader's interpretation, leading to varying results.
- Not Foolproof: While the Wyckoff market cycle method is powerful, it is not infallible and is typically used in conjunction with other analysis tools.
The Five-Step Wyckoff Trading Strategy
Luckily, Wyckoff developed a five-step framework for applying his methodology. The following structure outlines how traders build Wyckoff trading strategies using price and volume analysis. It can be adapted to develop a Wyckoff forex trading strategy.
1. Determine the current market trend. Assess whether the overall market is bullish or bearish.
2. Choose your market. Find a pair that strongly correlates to this overall trend.
3. Find a pair currently undergoing accumulation or distribution.
4. Determine the pair’s readiness to move. This involves examining the Wyckoff phase of the asset and volume. If a Spring or UTAD has just occurred, you could consider it viable.
5. Find your entry. Traders often enter on Tests or LPS/LPSYs.
Final Thoughts
Despite its age, Wyckoff’s logic in forex trading remains relevant. It reflects important price–volume relationships and market structure, which support traders when determining key turning points. It may form the basis of a trading approach when combined with other types of technical analysis, such as harmonic patterns, indicators, and support/resistance levels.
If you want to apply the Wyckoff method or test other trading approaches, you can consider opening an FXOpen account to trade over 700 markets with tight spreads and low commissions.
FAQ
What Are the 4 Stages of the Wyckoff Cycle?
The Wyckoff cycle is a four-phase model that describes how markets move from consolidation to trend and back again. The four stages are accumulation (where institutional players build positions), markup (the resulting uptrend), distribution (where those positions are sold), and markdown (the subsequent downtrend).
What Are the Three Laws of Wyckoff?
The three laws of Wyckoff are foundational principles that govern price behaviour within the methodology. The Law of Supply and Demand determines the direction of price. The Law of Cause and Effect links the size of an accumulation or distribution phase to the magnitude of the resulting move. The Law of Effort vs Results compares volume (effort) to price movement (result) to assess whether a trend is likely to continue or reverse.
What Is the Wyckoff Trading Range?
The Wyckoff trading range is a consolidation phase where accumulation or distribution occurs before a trend develops. It reflects a balance between supply and demand, often preceding a breakout or reversal.
What Timeframe Is Popular for the Wyckoff Method?
The Wyckoff method is a multi-timeframe approach, though daily and weekly charts are the most commonly referenced. Patterns on higher timeframes tend to produce more defined schematics and more significant price moves.
Can You Use Wyckoff for Day Trading?
Day trading with the Wyckoff method is possible, though it demands a strong grasp of short-term market structure and fast interpretation of price and volume shifts. Traders typically apply Wyckoff schematics on intraday charts (e.g., 5-minute or 15-minute) while referencing higher timeframes for context.
What Are Wyckoff Trading Strategies?
Wyckoff trading strategies are systematic approaches built around identifying accumulation and distribution phases using price and volume analysis. They typically involve recognising a Wyckoff schematic, confirming its phase, and acting on key events like Springs, Tests, or Signs of Strength.
*Important: At FXOpen UK, Cryptocurrency trading via CFDs is only available to our Professional clients. They are not available for trading by Retail clients. To find out more information about how this may affect you, please get in touch with our team.
This article represents the opinion of the Companies operating under the FXOpen brand only. It is not to be construed as an offer, solicitation, or recommendation with respect to products and services provided by the Companies operating under the FXOpen brand, nor is it to be considered financial advice.
Stay ahead of the market!
Subscribe now to our mailing list and receive the latest market news and insights delivered directly to your inbox.


Latest articles

US Dollar Index: A Defining Week for the King of the Markets
The dollar heads into a pivotal week trading near 101.80, just off a 15-month high, with the Fed's July 29 meeting standing as the clear focal point. Markets currently price roughly a 65% chance of a hold, though renewed

NZD/USD: Inflation Surge Meets Strong US Dollar Pressure
On 21 July, Stats NZ reported an acceleration in inflation: the Consumer Price Index rose 1.5% in the second quarter, while the annual inflation rate climbed to 4.1%, its highest level in more than two years and slightly

Weekly Market Insights with Gary Thomson: The Week of Central Banks and Earnings
In this video, we’ll explore the key economic events and market trends, shaping the financial landscape. Get ready for insights into financial markets to help you navigate the week ahead. Let’s dive in!
In this episode of Market