


WTI Crude Oil Price Shows Bullish Trend Ahead of OPEC Meeting
FXOpen

As the chart indicates, on Monday, the price of WTI crude oil rose by approximately 1%.
Reuters reports that the bullish sentiment is driven by:
→ the upcoming OPEC+ meeting scheduled for 2 June;
→ expectations of high fuel demand with the start of the summer driving season and holiday season in the US.
Conducting a technical analysis of WTI crude oil on 10 May, we drew an ascending channel in blue and suggested a scenario of continued price growth within this channel.
Since then:
→ the price formed a low on 15 May at the level of 76.35, but quickly recovered from it. Thus, the bears' attempt to break the low of 8 May at the level of 76.68 quickly failed. In other words, there was a false breakout of the 8 May low.
→ A similar pattern occurred on 24 May – the price dropped below the 15 May low of 76.35, but quickly recovered.
Two false bearish breakouts are a bullish sign. And the strong behaviour of WTI crude oil prices on Monday confirms this.
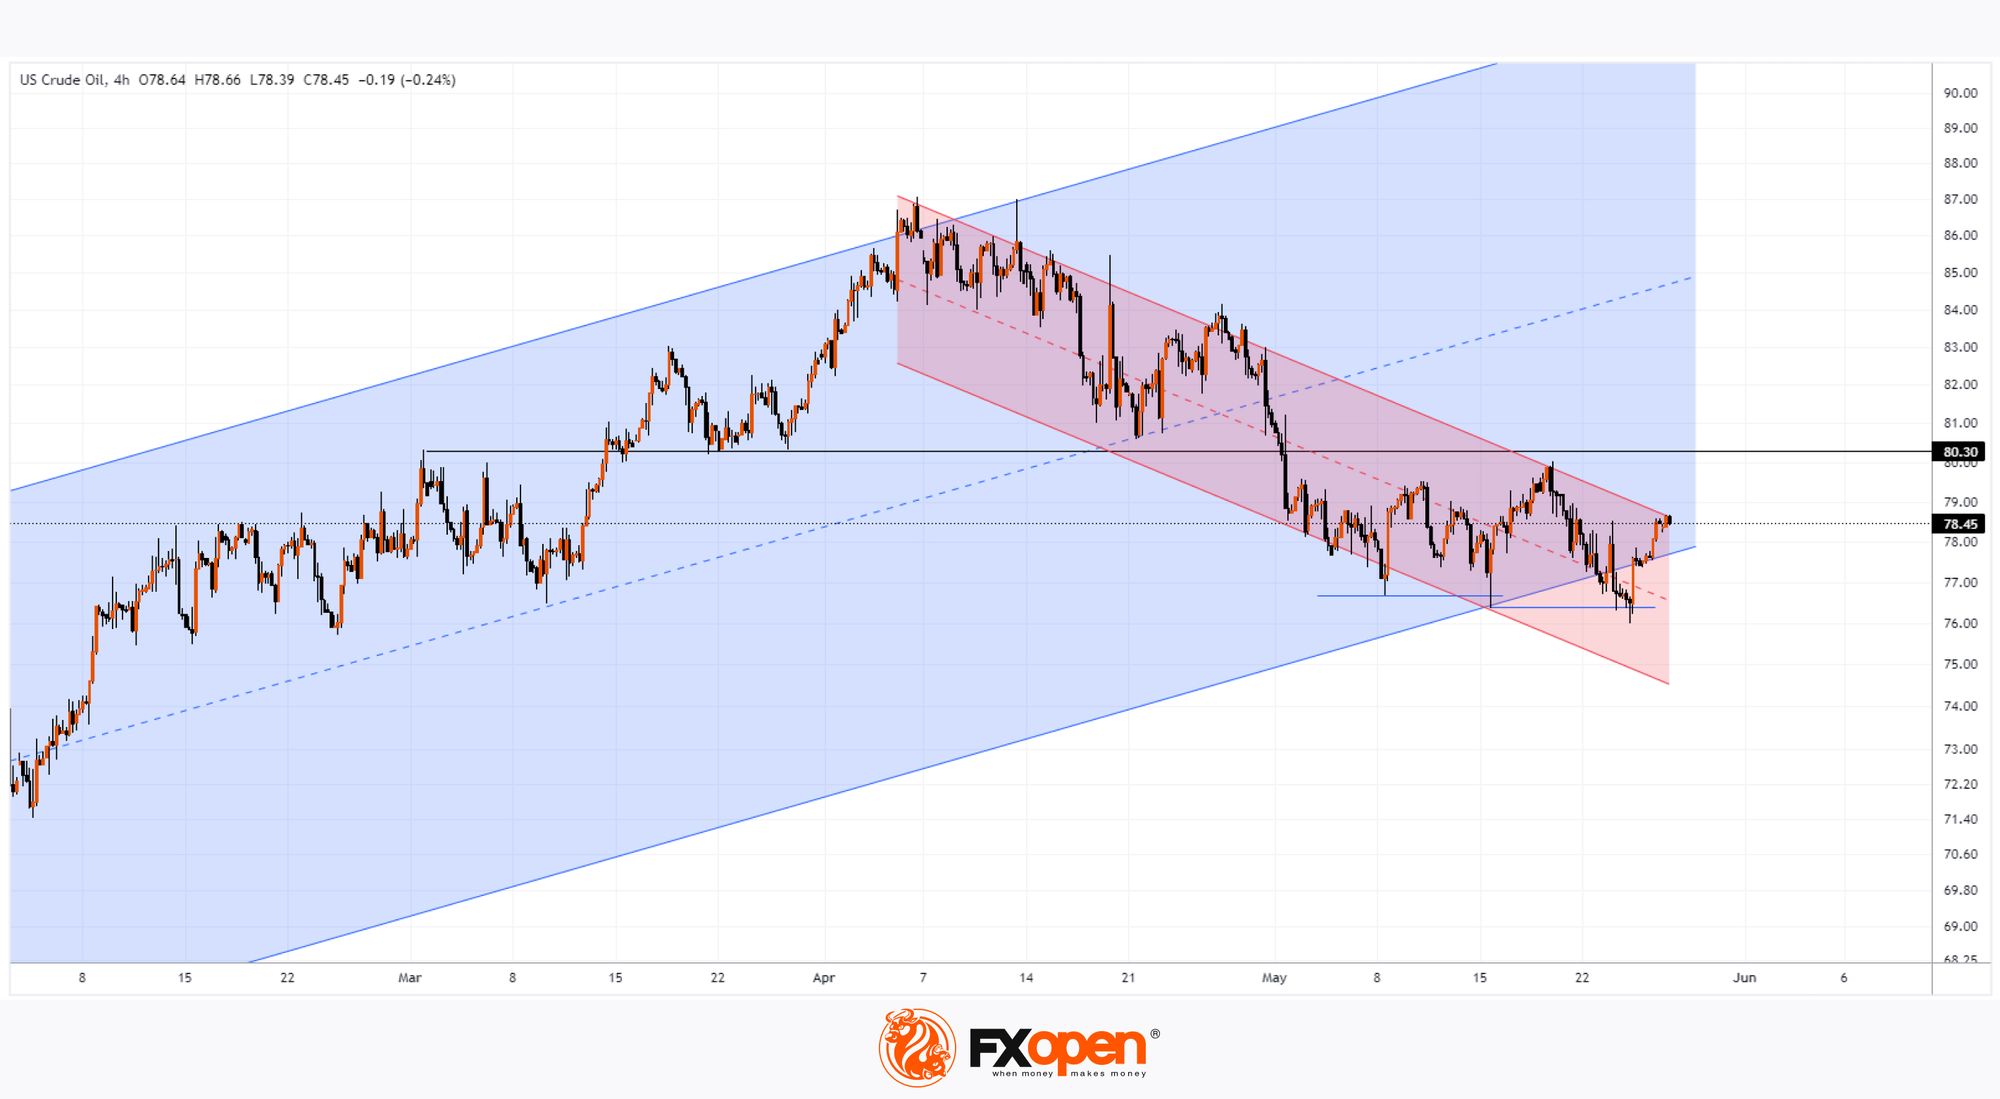
Analysing the XTI/USD chart today, it is important to note that:
→ the price movement in April-May forms a descending channel (shown in red);
→ this decline since 5 April may be a correction within the larger ascending blue channel;
→ the price quickly returned to the blue channel, briefly dipping below its lower boundary;
→ the price is near the upper boundary of the descending channel.
Thus, conditions are being created for the end of the corrective movement. The bears' inability to hold the WTI oil price at new lows may be used by the bulls to resume the upward trend. It is also possible that news related to the OPEC+ meeting will contribute to this development.
Start trading commodity CFDs with tight spreads (additional fees may apply). Open your trading account now or learn more about trading commodity CFDs with FXOpen.
This article represents the opinion of the Companies operating under the FXOpen brand only. It is not to be construed as an offer, solicitation, or recommendation with respect to products and services provided by the Companies operating under the FXOpen brand, nor is it to be considered financial advice.
Stay ahead of the market!
Subscribe now to our mailing list and receive the latest market news and insights delivered directly to your inbox.


Latest articles

AI Valuations Are Back in the Spotlight
Artificial intelligence remains the dominant investment theme of 2026, but investors are increasingly questioning whether AI stock valuations are keeping pace with reality.
💰 Big Tech continues to invest at an unprecedented scale, with hyperscaler AI spending projected to exceed $800

AUD/CAD: Months of Indecision — Is a Breakout Finally Coming?
The Australian dollar has clawed back most of its end-of-June losses, when it touched three-month lows against the greenback amid escalating Middle East tensions. Since then, sentiment has improved: the RBA's Assistant Governor Sarah Hunter signalled the board stands ready

USD/JPY: Battling at the Top of the Triangle
On 3 July, Japan's Finance Minister, Satsuki Katayama, stated that the Ministry of Finance remains in close contact with US authorities regarding developments in USD/JPY as the yen traded near its weakest level in almost 40 years. Similar verbal