


XAU/USD Analysis: 3 Reasons Why Gold’s Rally Might Pause
FXOpen

Today’s XAU/USD chart shows that gold continues to set records in September. The price has risen above $3,650 per ounce for the first time in history – one of the main drivers being expectations of a Federal Reserve rate cut on Wednesday, 17 September.
Easier monetary policy is generally seen as boosting gold’s appeal – this has pushed XAU/USD nearly 6% higher since the start of September. However, the chart highlights three reasons why further upside may be limited.
Technical Analysis of the XAU/USD Chart
1. Long-term channel:
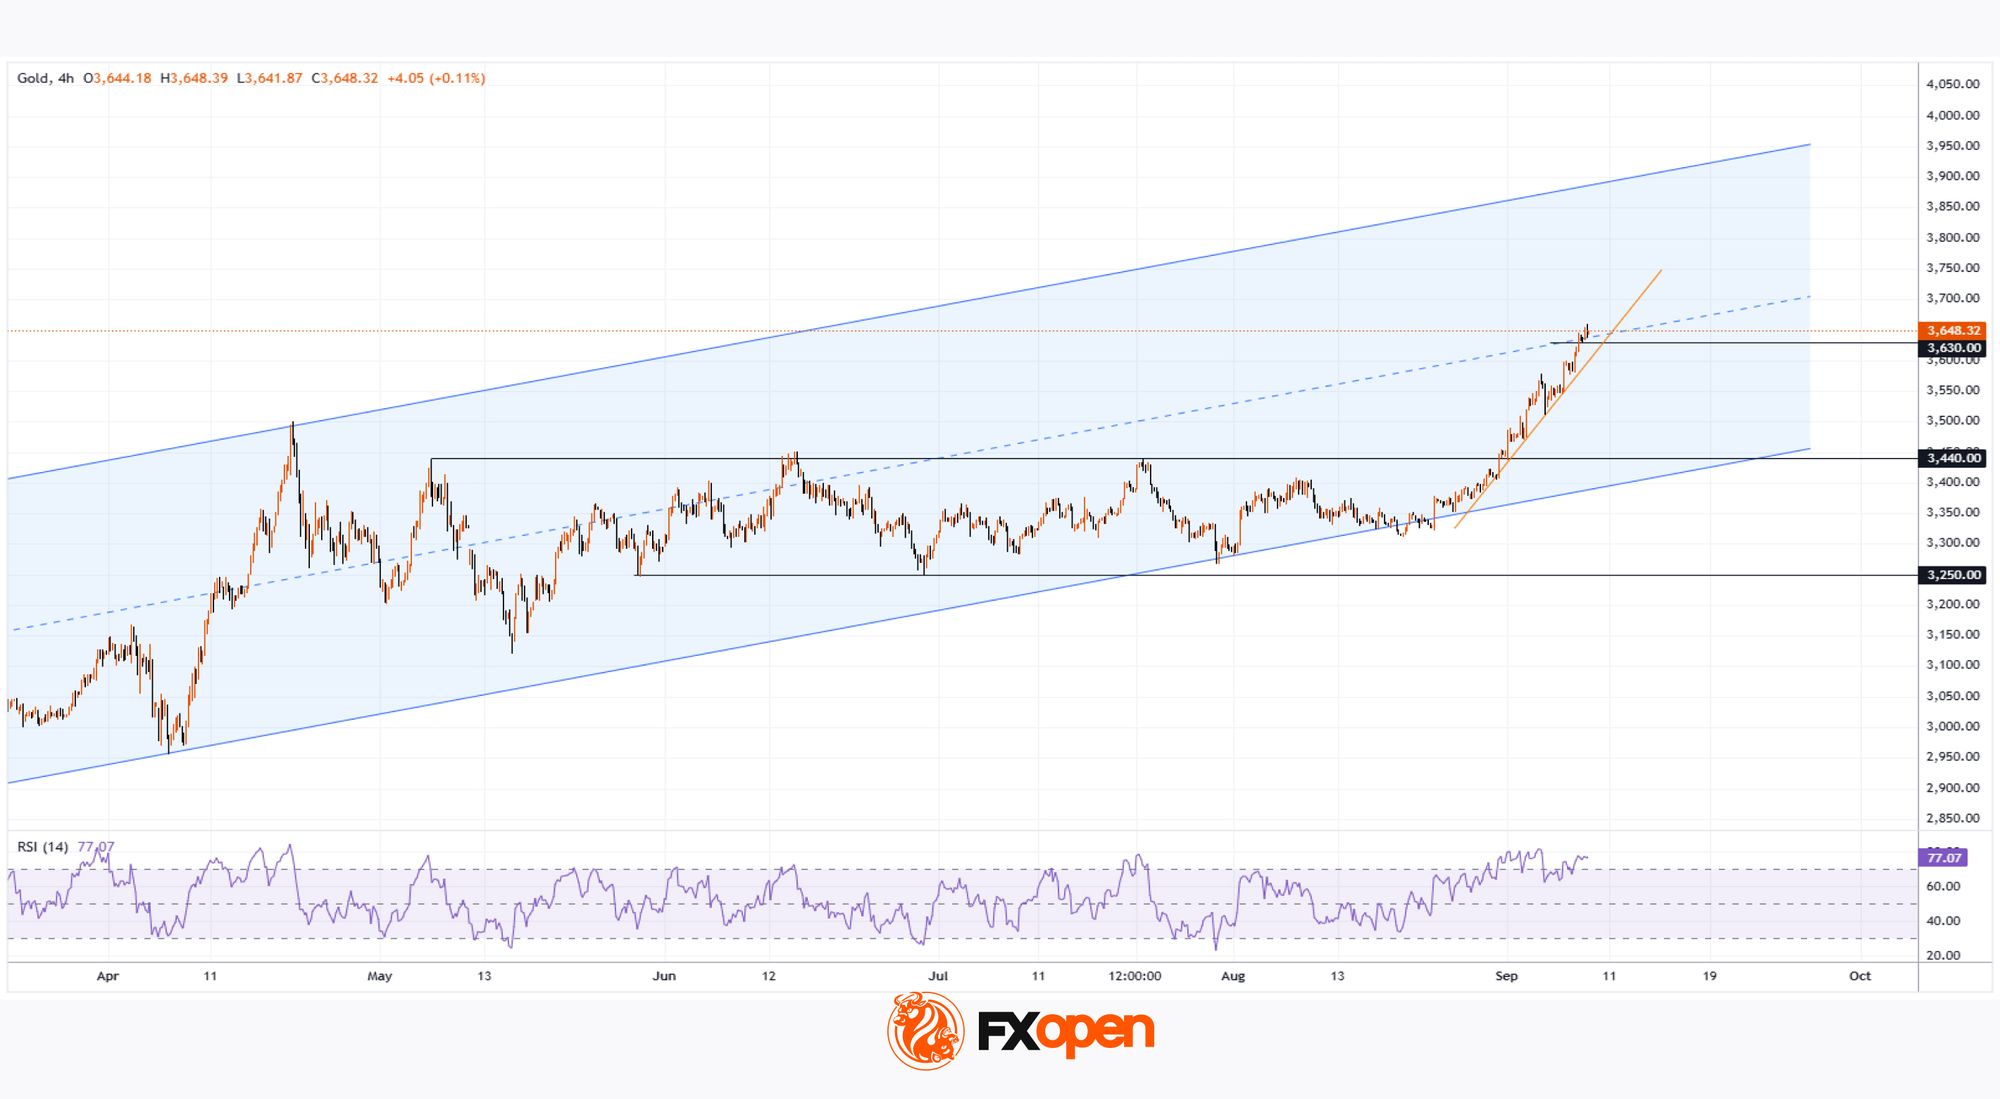
Over the course of 2025, gold price movements have formed an ascending channel (shown in blue), and today XAU/USD is trading close to its median line. This is where supply and demand typically balance out. Buyers may consider the post-September rally overstretched, while sellers could view the all-time high as an opportunity to take profits.
2. Rectangle pattern target reached:
The range between $3,250 and $3,440 that developed mid-year can be interpreted as a rectangle pattern. Following the bullish breakout, the implied target of $3,630 has already been achieved.
3. RSI signals risk:
The RSI indicator is close to forming a bearish divergence.
Given the steep angle of the orange support line, a correction – for example, towards the psychological level of $3,550 – might occur.
In summary, gold’s upward momentum may start to slow. At the same time, given the market’s inertia, traders may have little reason to expect a decisive shift away from bullish dominance. Still, next Wednesday could bring surprises.
For expert projections, see the article: Analytical Gold Price Forecasts for 2025, 2026, 2027, and Beyond.
Start trading commodity CFDs with tight spreads (additional fees may apply). Open your trading account now or learn more about trading commodity CFDs with FXOpen.
This article represents the opinion of the Companies operating under the FXOpen brand only. It is not to be construed as an offer, solicitation, or recommendation with respect to products and services provided by the Companies operating under the FXOpen brand, nor is it to be considered financial advice.
Stay ahead of the market!
Subscribe now to our mailing list and receive the latest market news and insights delivered directly to your inbox.


Latest articles


Market Repricing of Risk as Gold Loses Safe-Haven Demand
Geopolitical tensions in the Middle East had remained the primary macro driver for the gold market over recent weeks; however, on 8 April the situation shifted sharply as the United States and Iran agreed to a temporary two-week ceasefire, including

Commodity Currencies on the Rise: Market Focus Shifts to US and Canadian Data
Commodity-linked currencies continue to strengthen, while the US dollar remains under pressure amid easing geopolitical tensions and a shift in investor preference towards riskier assets. Reports of a temporary ceasefire between the US and Iran have helped stabilise sentiment and