


FXOpen

The XAU/USD chart shows that gold has reached a historic high, surpassing the psychological level of $2700.
According to Yahoo Finance:
→ Bullish momentum is being driven by central banks increasing their gold reserves;
→ Goldman Sachs analysts have raised their gold price target from $2700 to $2900.
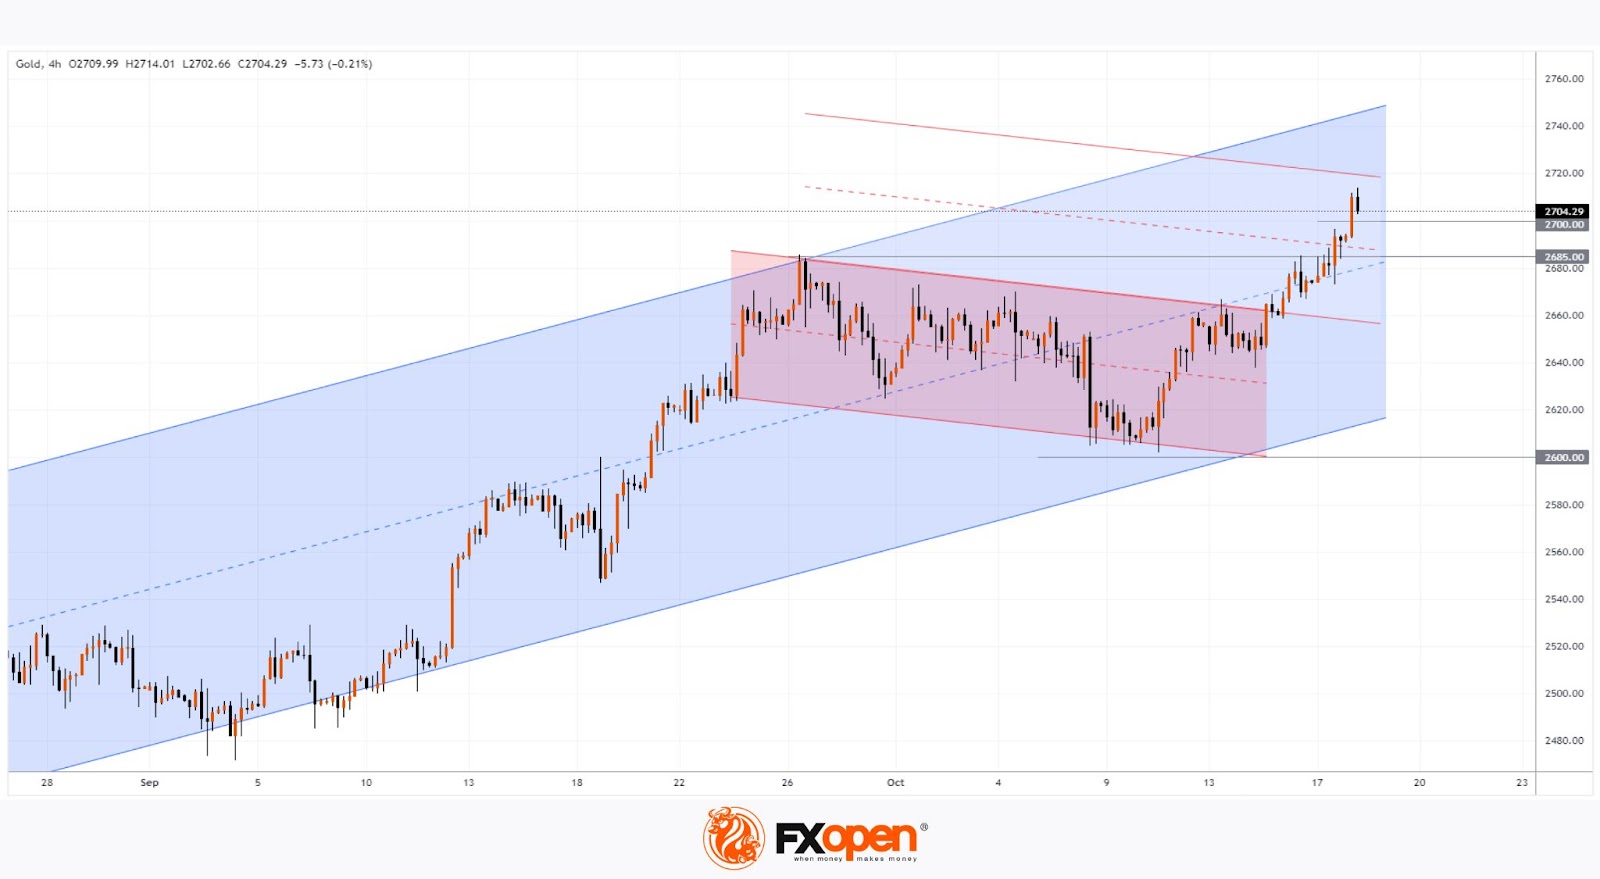
On 9 October, when analysing the gold price chart, we identified an ascending channel (shown in blue) and suggested that bulls might attempt to resume the upward trend from the $2600 level. Since then, the price has broken above a downward channel (shown in red), which could be viewed as a corrective move.
Today, a technical analysis of the XAU/USD chart indicates that gold has moved into the upper half of the blue channel, surpassing its median, signalling strong demand.
Can the rally continue?
It is possible that gold's price will continue to be supported by economic news and geopolitical instability.
From a technical perspective, the gold price has several support levels on the chart:
→ The median line of the blue channel;
→ Previous resistance near the $2685 level;
→ The psychological level of $2700.
Considering the height of the red corrective channel on the XAU/USD chart, the bulls' target could be the upper boundary of a parallel channel of the same height, projected higher.
Start trading commodity CFDs with tight spreads (additional fees may apply). Open your trading account now or learn more about trading commodity CFDs with FXOpen.
This article represents the opinion of the Companies operating under the FXOpen brand only. It is not to be construed as an offer, solicitation, or recommendation with respect to products and services provided by the Companies operating under the FXOpen brand, nor is it to be considered financial advice.
Stay ahead of the market!
Subscribe now to our mailing list and receive the latest market news and insights delivered directly to your inbox.


Latest articles

Market Analysis: GBP/USD Dips Further As EUR/GBP Regains Traction
GBP/USD failed to climb above 1.3500 and corrected some gains. EUR/GBP started a decent increase and might aim for more gains above 0.8700.
Important Takeaways for GBP/USD and EUR/GBP Analysis Today
· The British Pound


Market Insights with Gary Thomson: Oil, US Retail Sales & NFP in Focus
In this video, we’ll explore the key economic events and market trends, shaping the financial landscape. Get ready for insights into financial markets to help you navigate the week ahead. Let’s dive in!
In this episode of Market