


XNG/USD Analysis: Bears Pressure Key Support
FXOpen

On 5 December, while analysing the natural gas chart, we noted that price movements:
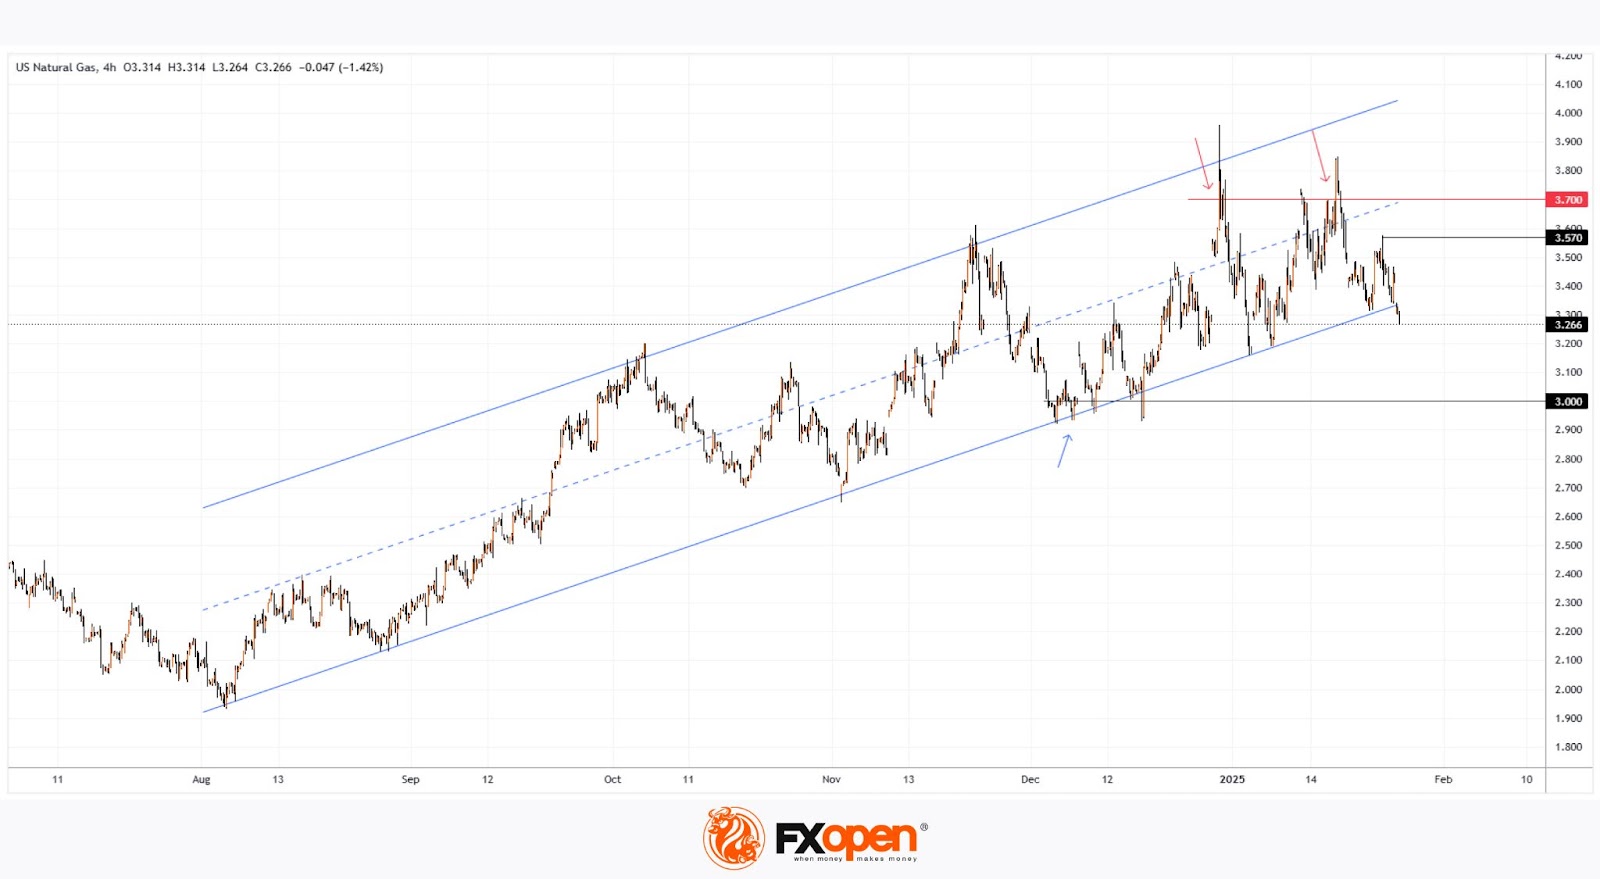
→ were forming an ascending channel (shown in blue);
→ support from the lower boundary of the channel (reinforced by the psychological level of 3.000) was already evident in a nascent price reversal (indicated by an arrow).
As the XNG/USD chart illustrates, since that time (marked by a blue arrow), the price indeed rose, using the support from the lower boundary of the channel to reach its upper boundary on 30 December.
However, we now see supply forces displaying aggression – whenever the natural gas price climbs above 3.700, bears quickly intervene (marked by red arrows), pushing the price back down.
What could happen next?
From a technical analysis perspective of the XNG/USD chart:
→ The price is hovering near the key support, formed by the lower boundary of the ascending channel (which has been in place since last summer).
→ Bearish aggression, as mentioned above, sets the stage for a potential bearish breakout of this critical support, evidenced by the bearish gap at Monday’s market open.
From a fundamental analysis standpoint:
→ Meteorological reports of colder weather drove the price up to 3.570, but this appears to be a temporary rebound.
→ Bearish sentiment in the natural gas market may be amplified by statements from the Trump administration expressing a determination to lower oil prices.
Start trading commodity CFDs with tight spreads (additional fees may apply). Open your trading account now or learn more about trading commodity CFDs with FXOpen.
This article represents the opinion of the Companies operating under the FXOpen brand only. It is not to be construed as an offer, solicitation, or recommendation with respect to products and services provided by the Companies operating under the FXOpen brand, nor is it to be considered financial advice.
Stay ahead of the market!
Subscribe now to our mailing list and receive the latest market news and insights delivered directly to your inbox.


Latest articles

USD/CAD: One Trendline Away From Deciding the Next Move
After several strongly positive weeks, USD/CAD has stalled over the past few sessions, entering a phase of uncertainty.
On the dollar side, Fed Chair Kevin Warsh has struck a firm tone, reaffirming the 2% inflation target and pushing back

Amazon: New Bond Issuance to Fund AI Infrastructure
On 7 July, Amazon announced an eight-tranche bond offering worth at least $25 billion, with the proceeds expected to finance the construction of data centres and the expansion of its artificial intelligence infrastructure. Investor demand peaked at $62 billion, highlighting

Weekly Market Insights with Gary Thomson: US Inflation, UK GDP, Chair Warsh Testimony, and Earnings
In this video, we’ll explore the key economic events and market trends, shaping the financial landscape. Get ready for insights into financial markets to help you navigate the week ahead. Let’s dive in!
In this episode of Market