Pin Bar Pattern
FXOpen

Price action is one of the most important trading strategies, as it puts traders in the right action at the right time. So, price action strategies concentrate on the traders’ behavior at the current moment, whilst analysis strategies are more interested in the past and the future. The uniqueness of price action is that it makes us trade what we see not what we think.
In fact, there are many types of price action strategies, such as: breakout strategies, and reverse strategies. In this article, I will talk about one of the most effective price action reversal patterns, it is pin bar pattern.
What is Pin Bar in Forex? Pin Bar Structure
Pin bar is actually a single bar with a long wick and very small body. The wick is two or three times the size of the bar body. This means that the open and close of the pin bar are very close or maybe equal. The body is formed near one end of the bar, and the end opposite to the wick is called nose. The wick should stick out from the recent surrounding price bars.

According to the trend, there are two types of a pin bar: the bullish pin bar occurs after a downtrend and has an upper body and a longer lower wick. Actually, it doesn’t matter if the close is higher than the open, but it will be better and stronger if the bullish pin bar has a bull close. It is vice versa for the bearish pin bar.

Pin bar psychology:
The reason of the powerful pin bar is in its psychological behavior. The pin bar pattern shows that a price level has been rejected at a certain point. To understand the nature of this behavior, we will take an example. The next image shows a bullish bin par, this bar says that the bears were in charge at the beginning, and they moved the price to the low of the bar. Then the bulls became stronger to prevent the advance of the bears that have run out steam. Finally, the bulls were able to reject the price to close at the top of the bar. All these activities emphasize that the bulls are in charge at the current moment, and they can move up the market. Thus, we can consider the pin bar pattern as a potential reversal indicator.

Trading pin bar pattern:
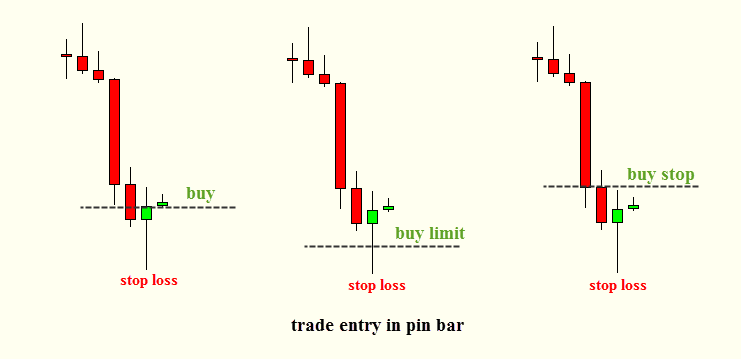
Since we realized that the pin bar is a reversal pattern, we can take trades by any appropriate entry: market entry, limit entry, or stop entry.
Bullish Pin Bar
Market entry: Trader can place buy order immediately, after the pin bar is formed.
Limit entry: Trader can place buy limit order at 50% of the wick, and the order will be integrated as soon as the price retraces to this point.
Stop entry: Trader can place buy stop order 1 pip above the high of the pin bar, the order will be integrated on the break of the high.
Stop loss is placed 1 pip below the low of the pin bar.
Bearish Pin Bar
Market entry: Trader can place sell order immediately, after the pin bar is formed.
Limit entry: Trader can place sell limit order at 50% of the wick, and the order will be integrated as soon as the price retraces to this point.
Stop entry: Trader can place sell stop order 1 pip below the low of the pin bar, the order will be integrated on the break of the low.
Stop loss is placed 1 pip above the high of the pin bar.
To make accurate trading, we must detect the right structure of the pin bar. In addition, we can use other confirming factors such as: key levels of support and resistance, moving average, Fibonacci retracement …etc. Pin bar occurs in all market conditions, but it is better and stronger in the trending markets. Generally, we can trade the pin bar on any time frame, but it is more accurate on 1h, 4h, and 1d time frames.
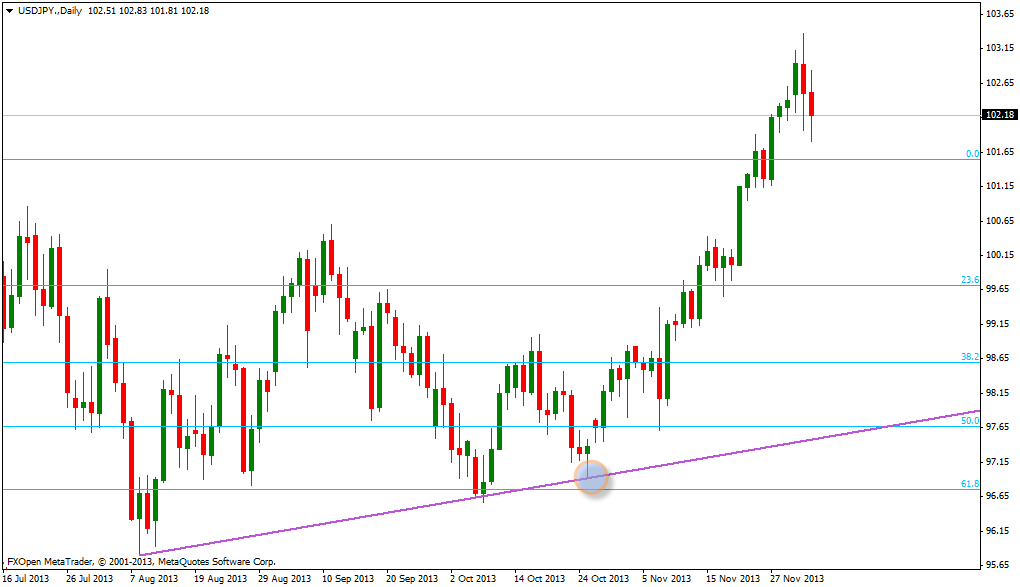
The next image produce a pin bar on daily USDJPY chart. The bullish pin bar touched the uptrend on (25/10/2013) near 61.8 Fibonacci level. These supports rejected the pin bar, and then the price ran up about 600 pips.
And this image shows bullish and bearish pin bar on 4H EURUSD chart

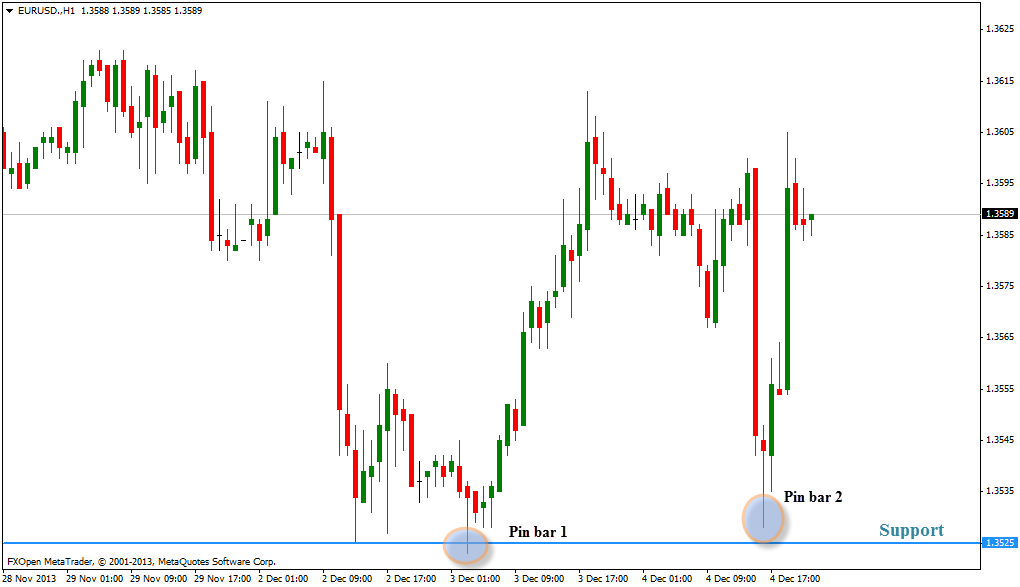
And this is 2 bullish pin bars on 1H EURUSD chart
And this is a bearish pin bar on daily EURJPY chart

And finally, a bearish pin bar on 1H USDCHF chart, and I have already taken this trade today.

As for me, I prefer to trade the pin bar on higher time frames, depending on the keys levels of support and resistance. I usually take trades by placing stop entry orders.
This article represents the opinion of the Companies operating under the FXOpen brand only. It is not to be construed as an offer, solicitation, or recommendation with respect to products and services provided by the Companies operating under the FXOpen brand, nor is it to be considered financial advice.
Stay ahead of the market!
Subscribe now to our mailing list and receive the latest market news and insights delivered directly to your inbox.

Latest articles

Australian Dollar Loses Momentum After May Peaks
Fundamental Background
The RBA’s third consecutive interest rate increase to 4.35% reflects the regulator’s concern over rising inflation: the conflict in the Middle East is increasing energy costs and putting upward pressure on prices. Annual consumer inflation