


Price Oscillator: Using the Indicator for Trading Strategies
FXOpen
Moving averages are one of the most commonly used trading tools, but many are unaware of a valuable indicator that makes reading these averages easier – the Price Oscillator. In this article, we will take a deep dive into this indicator, discussing how it works, its uses, and its limitations.
Definition of the Price Oscillator Indicator

The Price Oscillator, or PO, is a momentum indicator that traders use to assess the direction and strength of a market trend by comparing two moving averages. As a difference oscillator, the Price Oscillator subtracts a long-term moving average from a short-term moving average, providing a value that oscillates above and below a zero line.
This tool helps traders discern the speed or force behind market movements, providing essential insights into potential trend changes. The values the PO generates reflect the relationship between two different sets of price data, indicating how shorter-term price movement relates to longer-term trends.
While it is similar to other oscillators, the Price Oscillator's focus on absolute differences between moving averages offers unique insights into market dynamics. It presents a decent stepping stone for traders looking to build on or utilise moving averages in their trading.
How the Price Oscillator Works
The Price Oscillator is relatively simple, depicting the difference between two exponential moving averages (EMAs). While moving averages, in essence, smooth out price data to identify trend direction, the Price Oscillator goes a step further.
Calculating the PO involves subtracting a longer-term EMA (such as a 200-period EMA) from a shorter-term one (like a 50-period EMA). As a formula, this is:
Price Oscillator = (Short-term EMA - Long-term EMA)
The result is a value that fluctuates above and below zero, providing insights into market momentum and potential shifts in trend direction.
When the PO is above zero, it indicates that the short-term average is higher than the long-term average, suggesting upward momentum or bullish conditions. Conversely, when the Price Oscillator is below zero, it signifies that the short-term average is lower than the long-term average, indicating downward momentum or bearish conditions.
Typically, the default values for the short-term and long-term EMAs of the Price Oscillator are 10 and 21, respectively. However, these can be changed to suit the trader’s preferred lengths; a swing trader may prefer longer periods, while a day trader may stick with the defaults.
Before attempting to calculate the Price Oscillator in Excel, head on over to FXOpen’s own TickTrader platform. There, you’ll find the Price Oscillator alongside dozens of other trading tools ready to help you navigate the markets.
How to Use the Price Oscillator in Trading
The Price Oscillator's primary use is to aid traders in identifying potential trend reversals and momentum shifts in the market. By providing a visual representation of the relationship between two moving averages, it allows traders to spot when the short-term momentum of a market may be diverging from the long-term trend, indicating potential opportunities for entering or exiting trades.
As previously mentioned, when the PO is above zero, it denotes that the short-term average is exceeding the long-term one. This is generally seen as a bullish signal, indicating upward momentum. Traders might consider this a favourable time to initiate long positions or exit short trades.
On the other hand, when the PO falls below zero, it signifies the short-term average is lagging behind the long-term one. This condition typically represents a bearish signal, suggesting downward momentum. Traders may perceive this as an opportunity to enter short positions or liquidate long ones.
Additionally, traders often look for a divergence between the Price Oscillator and price action as potential signals of a trend reversal. For instance, if an asset is making new highs while the Price Oscillator fails to reach new highs, this divergence can indicate weakening upward momentum and a potential trend reversal to the downside.
Example of the Price Oscillator in Action

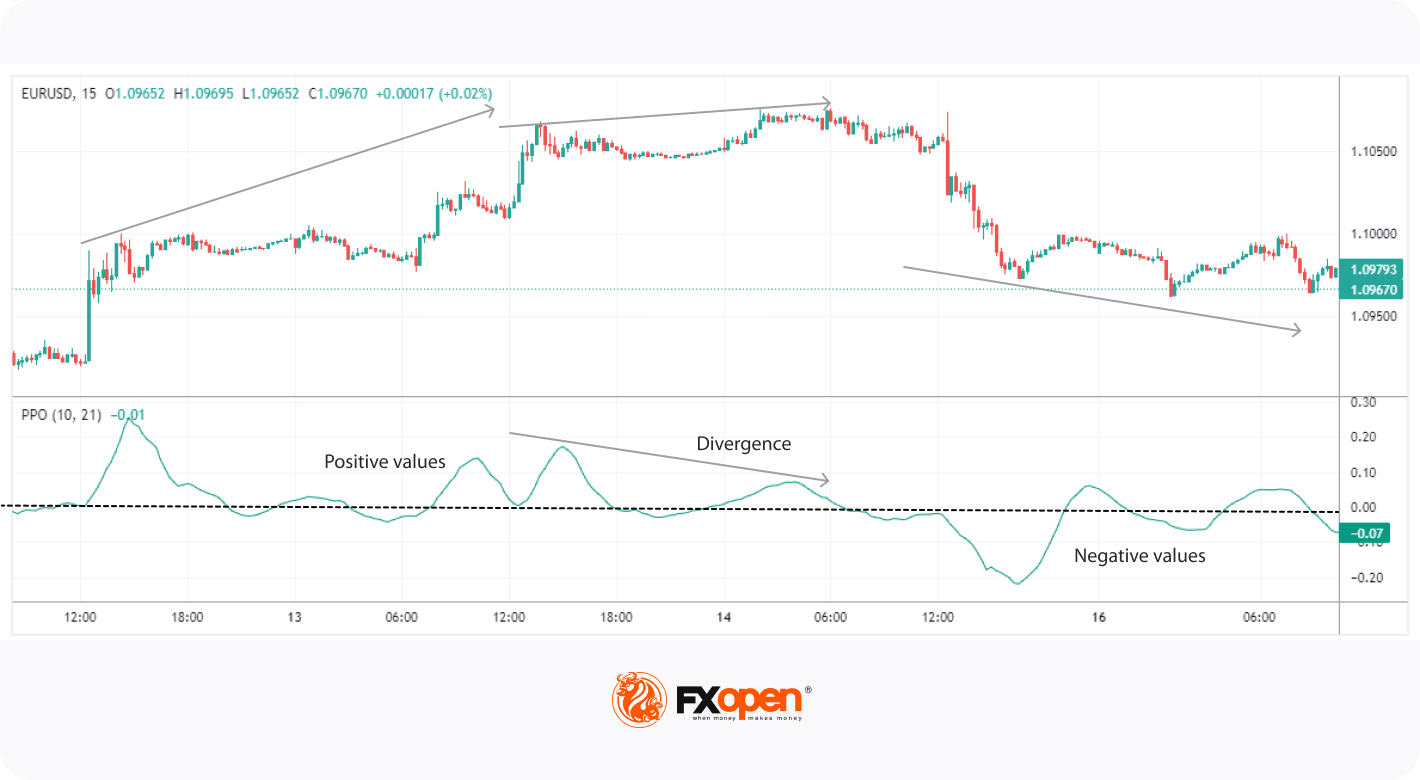
In this EUR/USD example, we can see the indicator set to the standard 10 and 21 periods. On the left-hand side, the Price Oscillator is losing downward momentum, meaning a potential uptrend may be inbound.
After starting this new uptrend, the PO jumps, creating a tall peak. This is the first signal that the price may be turning bullish. As the trend cools off slightly, the PO falls back to 0 – but notice how it doesn’t move below 0. After moving up again, the PO continues to plot positive values, holding above 0. During this time, traders can position themselves long with confirmation from the PO.
On the right-hand side of the chart, we see a break in the trend confirmed with a strong move down well below the 0 line. Interestingly, there was also a bearish divergence between the PO and price prior to this drop. As the price pulls back after the initial drop, traders might anticipate this bearish trend to continue, given the steep move into negative territory, and enter short.
Limitations and Risks of the Price Oscillator
Like all technical indicators, the Price Oscillator is not without its limitations and potential risks. One significant drawback is the occurrence of false signals, which may lead traders to initiate trades based on misleading information. For instance, the PO might indicate a bullish signal by moving above zero, prompting a trader to buy. However, if the market doesn't follow through and instead reverses direction, this could lead to a losing trade.
Another limitation is the Price Oscillator's reliance on historical data, which might not be an accurate reflection of future market movements. Market conditions can change rapidly due to a variety of unforeseen events, such as economic news, making predictions based solely on past price movements risky.
Finally, the Price Oscillator is most effective in trending assets, and its signals can be less reliable during periods of sideways or ranging markets. In choppy markets, you’ll likely see small fluctuations around the zero line, which can be particularly confusing if the wider context isn’t considered.
The Bottom Line
The Price Oscillator is a valuable tool that goes beyond a standard pair of moving averages. While it may not be the most advanced indicator, it can help identify both trends and reversals in an easy-to-read visual chart, which can be especially useful for some. If you’re ready to start using the Price Oscillator, you can open an FXOpen account and try your hand at trading over 600+ markets alongside lightning-fast execution speeds and competitive trading costs. Happy trading!
FAQs
How do you read a Price Oscillator?
To read a Price Oscillator, observe the oscillator values in relation to the zero line. When the oscillator is above zero, it indicates bullish momentum, while values below zero suggest bearish momentum. Traders also pay attention to the magnitude of the values, as larger positive or negative values may indicate stronger momentum.
How do you calculate a moving average?
To calculate a simple moving average, sum up a specified number of data points (e.g., closing prices) and divide the sum by the chosen period length. The result represents the moving average for that specific point in time. As new data becomes available, the moving average is recalculated, incorporating the latest data while dropping the oldest. There are other types of MAs which differ in the method of calculation. You can check them out here.
This article represents the opinion of the Companies operating under the FXOpen brand only. It is not to be construed as an offer, solicitation, or recommendation with respect to products and services provided by the Companies operating under the FXOpen brand, nor is it to be considered financial advice.
Stay ahead of the market!
Subscribe now to our mailing list and receive the latest market news and insights delivered directly to your inbox.


Latest articles

Amazon Earnings: Does the Chart Already Know Something the Numbers Don't?
All eyes are on July 30, when Amazon reports Q2 2026 earnings, with Wall Street increasingly convinced the bar has been set too low. Consensus sees EPS near $1.82-$2.26 on roughly $197 billion in revenue, but the

WTI Analysis: Gap Breaks Short-Term Trend as Price Remains Trapped Between the POC and Profile Boundary
WTI crude oil plunged by more than 7% on 27 July 2026 after the US suspended a series of strikes against Iran over the weekend, raising hopes of a diplomatic solution and the reopening of shipping through the Strait of

US Dollar Index: A Defining Week for the King of the Markets
The dollar heads into a pivotal week trading near 101.80, just off a 15-month high, with the Fed's July 29 meeting standing as the clear focal point. Markets currently price roughly a 65% chance of a hold, though renewed