


Rate of Change Indicator: Analysing Price Momentum with Precision
FXOpen
With so many complex indicators to choose from, sometimes it’s best to stick with the basics. One simple yet effective momentum oscillator is the Rate of Change indicator. In this article, we take a deep dive into how this indicator works, what signals it offers, and its potential drawbacks.
What Is the Rate of Change Indicator?
The Rate of Change technical indicator, often abbreviated to ROC, is a momentum oscillator that helps traders measure the speed at which prices are changing in the market. It does this by comparing the current price of an asset, like a stock or currency pair, to its price a certain number of periods ago.
Understanding the Rate of Change indicator is simple when you understand its guiding principle: momentum. Momentum, in the context of financial markets, is the tendency of an asset to continue moving in its current direction. The Price Rate of Change indicator offers traders a way to visually gauge this momentum relative to past price movements.
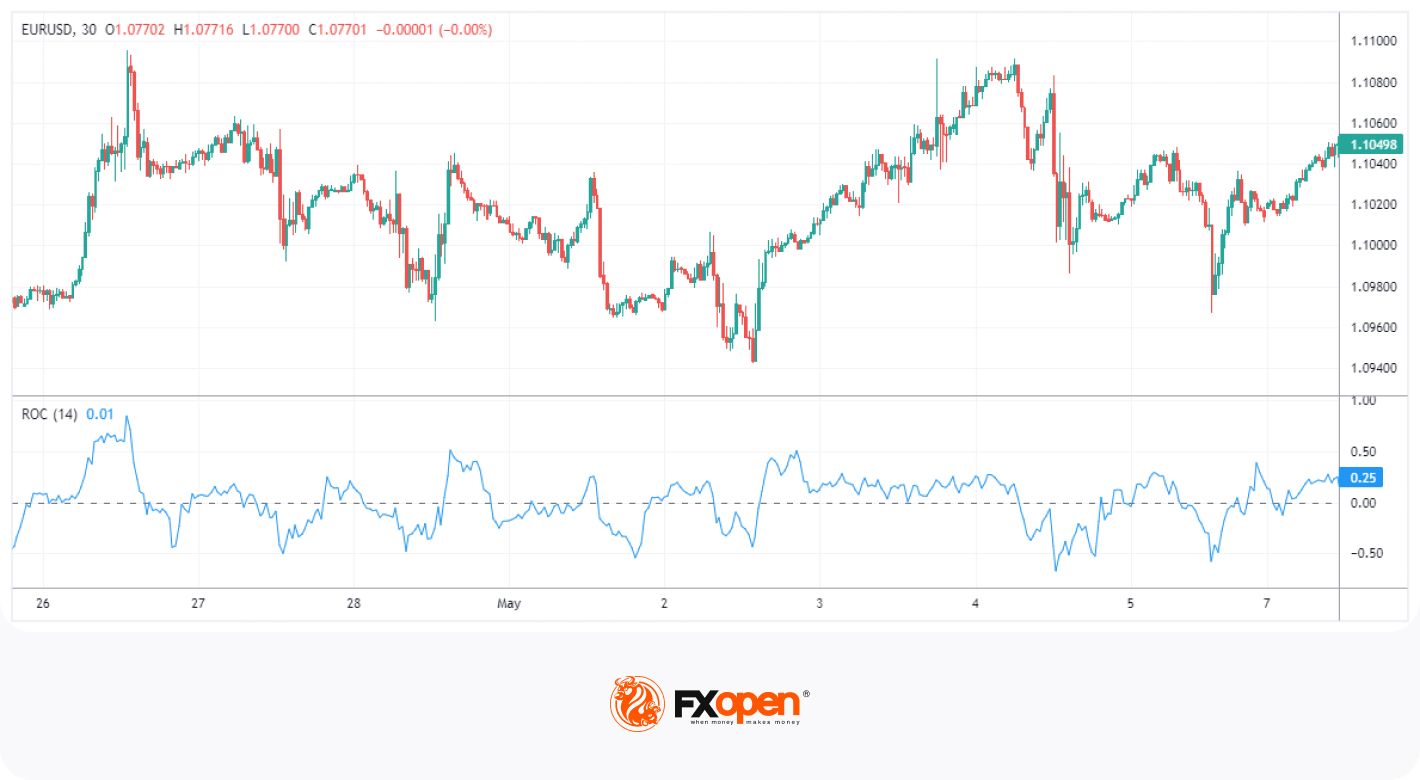
Plotted against a zero line in a window beneath the chart, the ROC fluctuates between positive and negative values, allowing us to determine whether bullish or bearish momentum is entering the market. While it’s rarely employed as a standalone indicator, the ROC can be used to confirm trends and highlight potential reversal points in the market.
Rate of Change Indicator Formula
Compared to other indicators, the Rate of Change ratio indicator has a fairly simple formula. You may recognise it as the formula for calculating a percentage change.
ROC = [(Current Price - Price n Periods Ago) / (Price n Periods Ago)] * 100
In this equation, the 'Current Price' is the most recent closing price, while 'Price n Periods Ago' refers to the closing price ‘n’ periods in the past, where ‘n’ is a chosen length of time. Generally speaking, the preferred Rate of Change indicator settings are 9 or 14 periods. For example, in forex, the Rate of Change indicator is often set to 14 periods since the higher period helps to smooth out its volatility.
The result is expressed as a percentage, which can be either positive (indicating the price has increased over the given period) or negative (suggesting a decrease). An increasing ROC, whether positive or negative, typically indicates an accelerating bullish trend; a decreasing ROC, whether positive or negative, suggests a growing bearish trend.
This simple calculation provides traders with a direct measure of price momentum, showing the rate at which an asset’s price has changed over the chosen period. The higher the ROC, the stronger the bullish momentum, and vice versa.
Unlike other momentum indicators, such as the relative strength index (RSI), the ROC doesn’t produce well-defined boundaries. Instead, traders are required to observe the indicator’s value relative to its previous values.
How to Use the Rate of Change Indicator in Trading
Now that we understand how to calculate the ROC indicator let’s take a look at how to interpret its readings. It produces three primary signals: zero-line crossovers, overbought/oversold levels, and divergences. If you’d like to follow along, you will find the ROC and dozens of other tools waiting for you in FXOpen’s free TickTrader platform.
Zero-Line Crossover
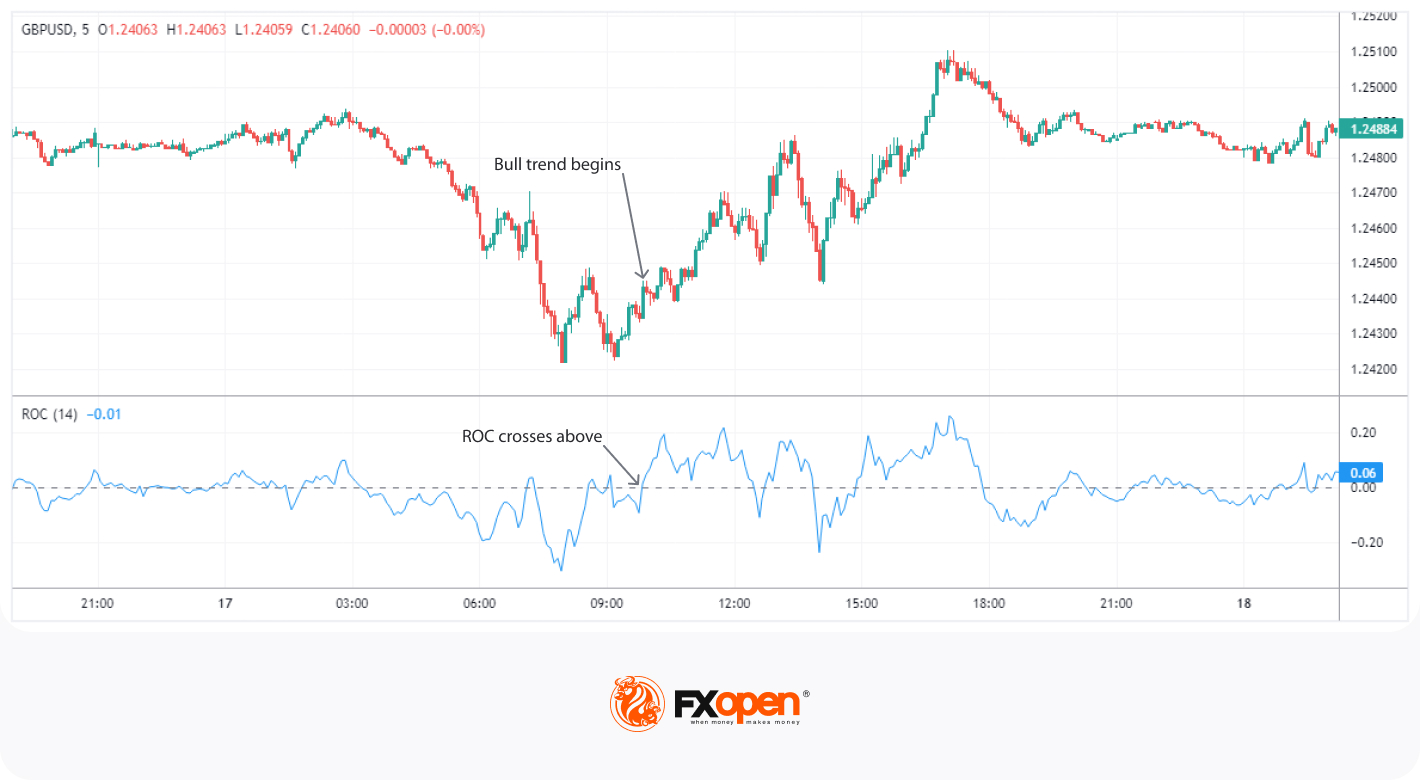
At the heart of the ROC is the zero line, which helps traders determine whether momentum is bullish or bearish. When the ROC crosses the zero line, it can signal a potential change in trend. For instance, crossing into positive values may suggest a bullish trend. However, these signals can vary based on the period you use - a lower period, like 5, might indicate a trend change early on, while a higher period, such as 20, might signal a trend change much later.
Bear in mind that the ROC can be prone to fluctuating around the zero line, leading to potential false signals. Therefore, zero-line crossovers shouldn't be treated as a tradeable signal, but they can serve as a hint for where the price may be headed next.
Overbought and Oversold Levels
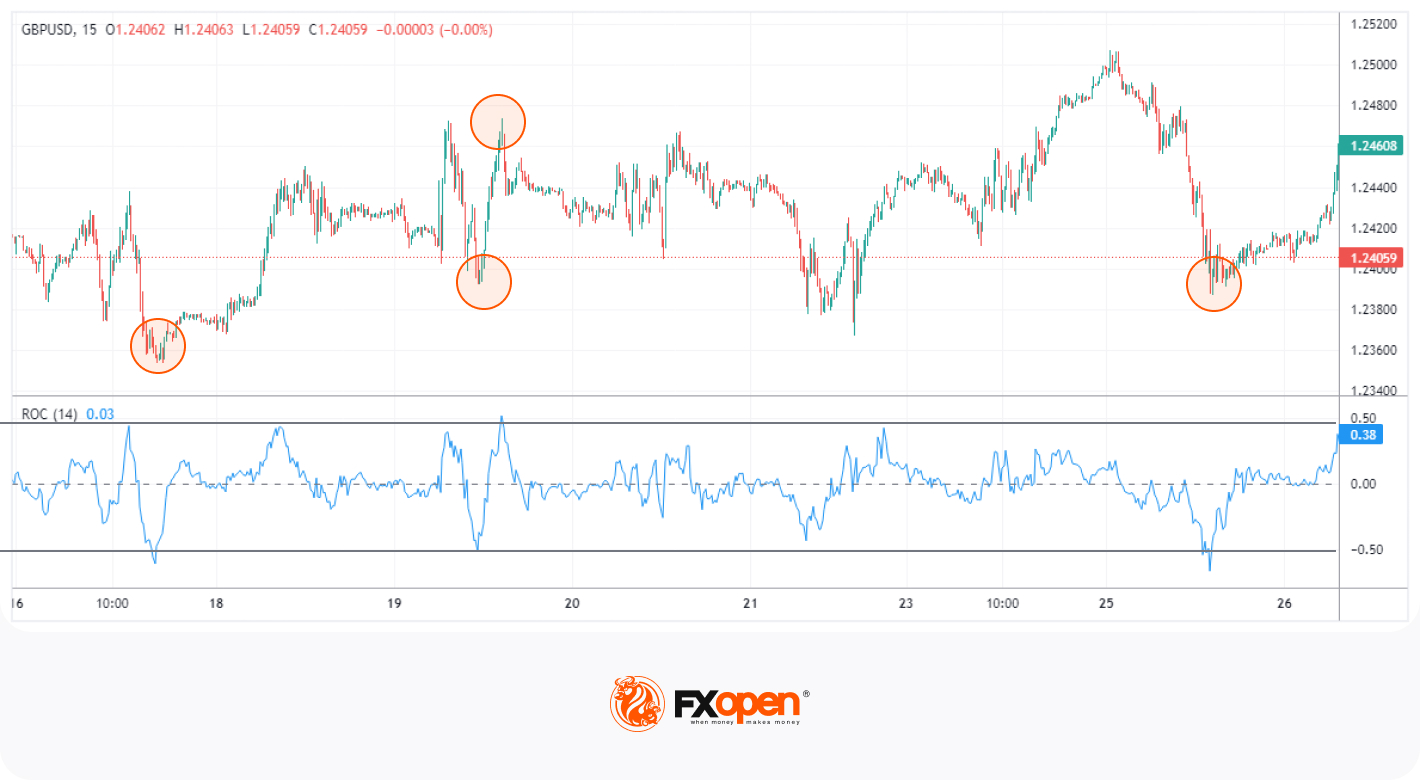
The ROC can also help identify overbought and oversold levels. As mentioned, the indicator doesn’t produce fixed levels like some momentum indicators. While this may present some challenges, traders can always look at historical values where the price reverses to determine whether an asset may be overbought or oversold.
For example, if you notice that bullish reversals frequently occur below the -0.5% level, then you could consider a move beneath -0.5% a Rate of Change indicator buy signal. As seen in the chart above, creating your own boundaries can offer decent reversal opportunities, However, it’s best to use additional technical analysis to confirm your bias and find an entry.
Divergences
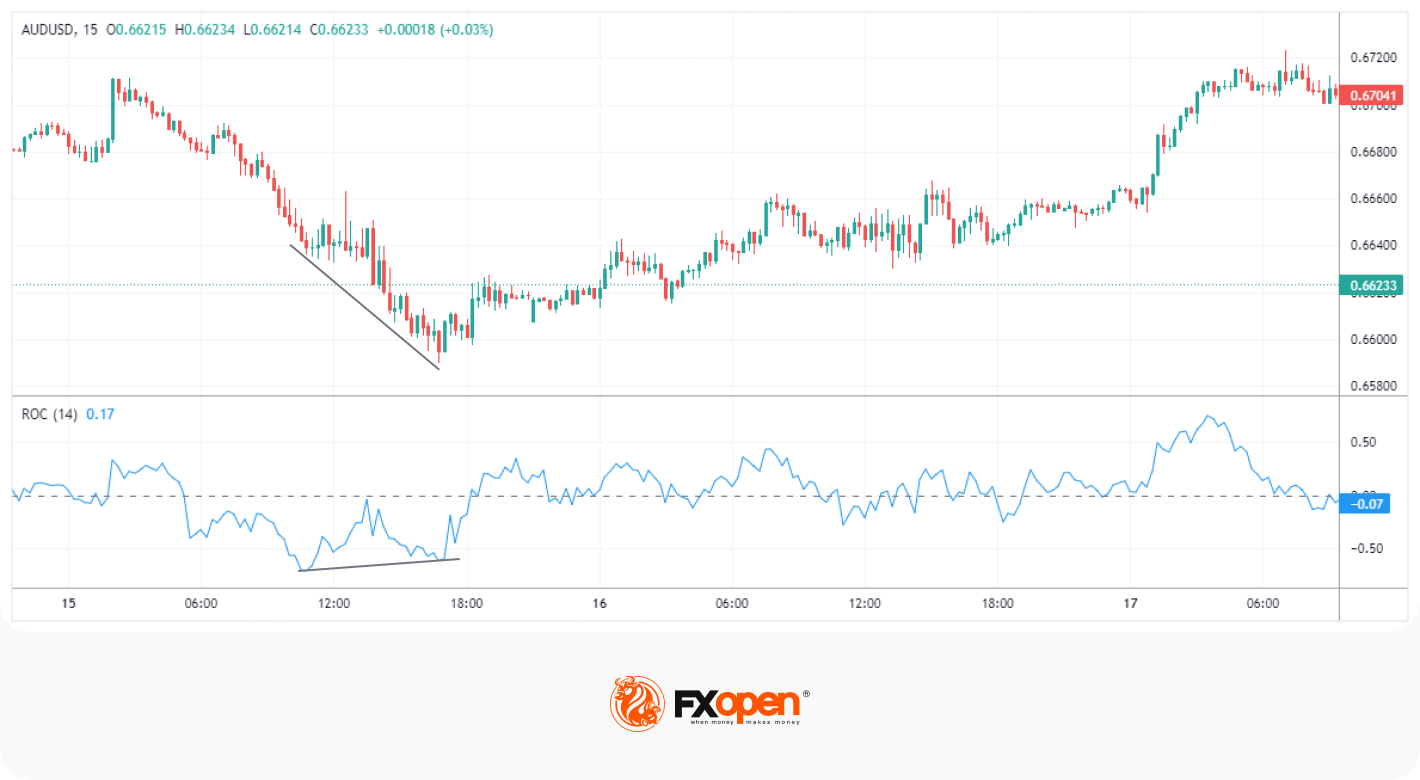
Lastly, the ROC can be used to identify divergences. A divergence occurs when the price and the ROC move in opposite directions. For example, if an asset’s price makes a new high while the ROC makes a lower high, it could indicate a bearish divergence and a potential downtrend. In other words, momentum is decreasing relative to previous price action as buying or selling pressure dwindles.
As with the other signals, ROC divergences should be treated with caution and confirmed with other indicators or tools. The nature of divergences requires that a definite high or low be made in the indicator; preempting a divergence without additional confluence or a high/low being plotted may lead to being stopped out prematurely, even if your bias was correct.
Limitations of the Rate of Change Indicator
Before adding the Rate of Change indicator to your strategy, it’s essential to be aware of some of its limitations.
One of the main issues with the ROC is its lack of responsiveness in sideways markets. Since the ROC is a momentum-based indicator, it requires significant price moves to generate signals. In a tightly range-bound market with little volatility, the ROC will typically remain near zero, providing little to no useful information.
Another potential drawback of the ROC is the reliability of its signals. Since it simply measures a percentage change over a given period, it could be argued that the indicator is too basic to provide any real insight into the market. While not necessarily true, its simplicity doesn’t offer much of a “filter” (for example, consider the RSI fixed overbought/oversold levels). This might not be an issue for traders looking to complement their existing strategy, but it may make the ROC unsuitable for beginners.
Finally, the effects of increasing the ROC’s period offer diminishing returns. As a tool for comparing the difference in percentage between the most recent price and the price ‘n’ periods ago, it excels. However, recent price action should be prioritised, meaning the period of ROC should be kept low.
For instance, if you were using the Rate of Change indicator on daily charts, there isn’t much value in comparing the percentage change since 100 days ago. While this isn’t an issue for most traders, it does limit the versatility of the indicator.
Closing Thoughts
In summary, the ROC indicator is a simple but effective tool that helps traders measure and analyse price momentum. It may not be as advanced as some other momentum indicators, but it can still play a valuable role in any technical analysis toolkit. Want to have a go at applying the ROC to live charts? You can open an FXOpen account to gain access to 600+ markets and benefit from our competitive pricing, ultra-fast execution speeds, and a partnership with Traders Union’s Most Innovative Broker of 2022. Good luck!
This article represents the opinion of the Companies operating under the FXOpen brand only. It is not to be construed as an offer, solicitation, or recommendation with respect to products and services provided by the Companies operating under the FXOpen brand, nor is it to be considered financial advice.
Stay ahead of the market!
Subscribe now to our mailing list and receive the latest market news and insights delivered directly to your inbox.


Latest articles

Weekly Market Insights with Gary Thomson: The Week of Central Banks and Earnings
In this video, we’ll explore the key economic events and market trends, shaping the financial landscape. Get ready for insights into financial markets to help you navigate the week ahead. Let’s dive in!
In this episode of Market

Intel at a Crossroads: Earnings Beat Meets Technical Resistance
Intel has just delivered its strongest quarter in over fifteen years, and the market reaction says it all. Q2 2026 revenue surged 25% year-over-year to $16.1 billion, crushing the consensus estimate of $14.42 billion, while adjusted EPS of

Tesla: Complex Range Structure Breaks Down Following Quarterly Earnings
Tesla released its Q2 2026 results after the market closed on 22 July. Revenue increased 26% year-on-year to $28.24 billion, while vehicle deliveries reached a record 480,126 units. However, operating margin fell sharply to 1.4%, down from