


Relative Strength vs Relative Strength Index: What Are the Differences?
FXOpen
While the Relative Strength and Relative Strength Index indicators might share similar names, it’s important to know the difference between the two. In this article, we’ll discuss their unique characteristics, offer insights into their differences, and help determine which one is best for you.
Understanding Relative Strength
Relative Strength (RS) is a method that helps traders assess the performance of a particular security compared to a benchmark or another security. For example, a trader may use Relative Strength to compare the performance of Microsoft’s MSFT stock to the S&P 500 and determine whether the stock is outperforming its benchmark.
Relative Strength is expressed as a ratio. It’s calculated by dividing the price of the chosen security by another. In this example, we would divide Microsoft’s current share price of approximately $280 by the market value of the S&P 500, around $3,980. This results in a Relative Strength of ~0.07.
In isolation, this figure doesn’t mean much. But plotted over time, it can show the trend of a security’s relative strength against a comparative security or benchmark. If this 0.07 value were to rise, it would mean that MSFT is outperforming the S&P 500, and vice versa if it were to decrease.
Relative Strength can be used as a tool to help highlight market leaders and laggards, as well as identify overvalued or undervalued assets. For instance, if an asset’s Relative Strength is well below its historical average, it could be undervalued and ready for a reversal.
Understanding the Relative Strength Index
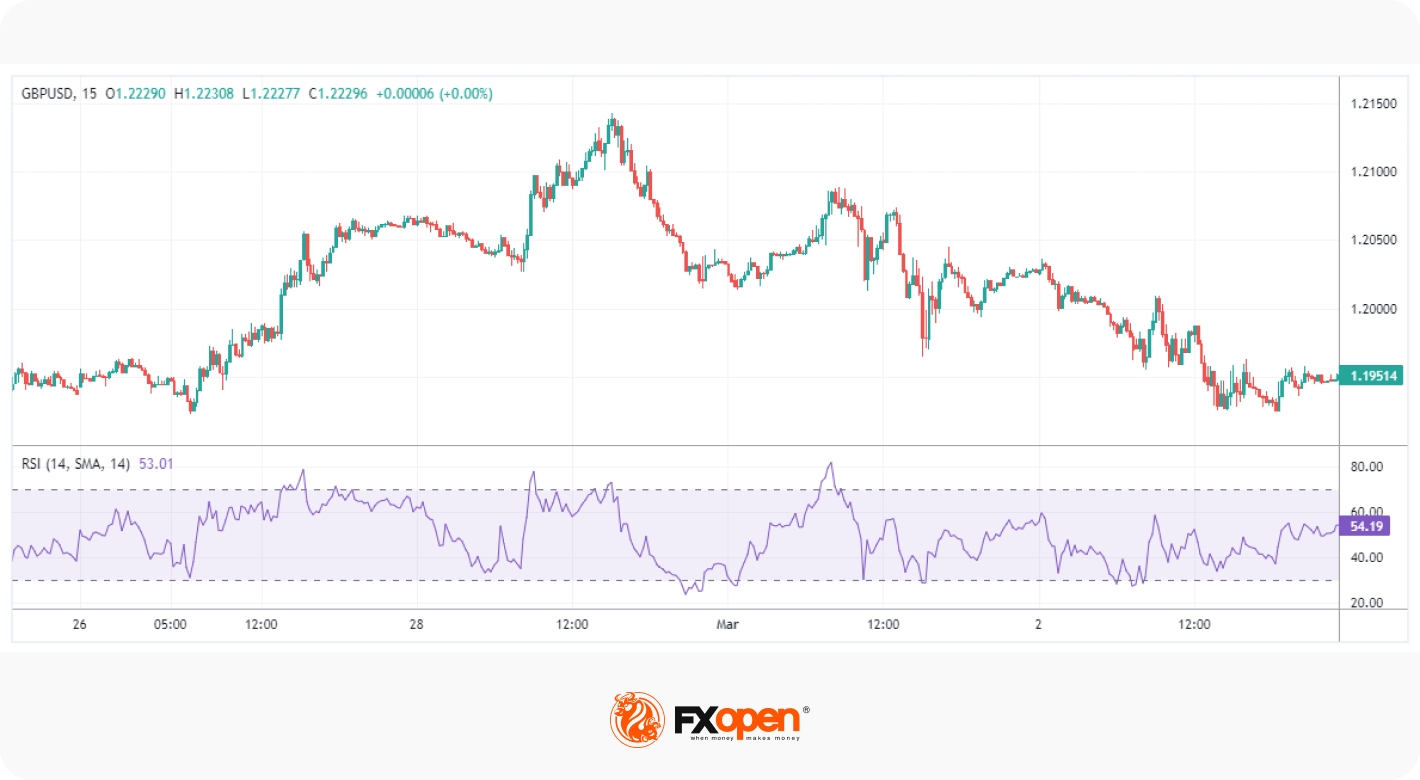
While they share similar names, Relative Strength and the Relative Strength Index (RSI) shouldn’t be confused. The RSI is a popular technical analysis tool and momentum oscillator that indicates overbought and oversold conditions in the market. RSI measures the speed and change of price movements, oscillating between 0 and 100.
To calculate RSI, the average gain and average loss of the security over a specific period, usually 14, are determined. The ratio of these averages is then used to calculate the RSI value. Formally, RSI can be expressed as:
RSI = 100 - (100 / (1 + (Average Gain Over Period / Average Loss Over Period)))
An RSI value above 70 indicates overbought conditions, suggesting the security may be due for a pullback. Conversely, an RSI value below 30 indicates oversold conditions, hinting that the price may see a bullish reversal. Furthermore, moves above the midpoint, 50, can confirm bullishness, while action below can show bearishness.
Traders predominantly use RSI to find potential entry and exit points in the market. For example, when the RSI moves above 70, traders might consider selling or shorting the security. Divergences, where the price forms a new high or low, but RSI fails to do the same, can offer additional opportunities to find reversal or continuation setups.
Want to see how RSI works firsthand? Hop on to our free TickTrader terminal at FXOpen to get started with RSI and dozens of other tools ready to help you navigate the markets.
Key Differences Between Relative Strength vs Relative Strength Index
So what exactly are the most significant differences between RS vs the RSI indicator?
Purpose
RS aims to compare the performance of a security to a benchmark or another security. Meanwhile, RSI measures the speed and change of price movements to identify overbought and oversold conditions in a single asset.
Calculation
This difference can be seen when comparing their calculations. Relative Strength is a simple ratio of two securities’ prices, whereas RSI is calculated using a more complex formula that accounts for average gains and losses over a specified period. In this sense, Relative Strength provides a broad picture of a security’s performance, while RSI is concerned with recent price action.
Use Case
When putting both into practice, traders will use Relative Strength and RSI in vastly different ways. Relative Strength can show which sectors, industries, or individual assets are outperforming their peers. This might help a trader formulate a hypothesis supporting a decision to invest in a particular market, like a stock or an Exchange Traded Fund (ETF).
Meanwhile, RSI focuses on a single asset’s momentum and is used to gauge potential trend reversals or the strength of the overall trend. This makes it better suited for entering and exiting positions rather than conducting top-down analysis.
Relative Strength vs RSI: Which Is Better?
Determining whether Relative Strength or RSI is better ultimately depends on the individual trader. Both indicators have unique strengths and different utilities.
Relative Strength may be better for helping longer-term traders and investors to identify trending markets. Throughout a day’s trading, Relative Strength might not indicate much; MSFT’s comparative performance to the S&P 500 can easily change each day. But, over weeks or months, a strong RS reading can demonstrate that MSFT is likely to continue outperforming the benchmark, making it a potential candidate for swing or position trading.
Likewise, traders looking to capitalise on trending sectors can use Relative Strength to determine attractive markets. For example, a trader may consider consumer staples a strong industry that could outperform the S&P 500 and then compare the S&P 500 Consumer Staples Sector ETF’s (ICSU) Relative Strength readings to the S&P 500 to confirm their prediction.
In contrast, while RSI can be applied across all timeframes, its focus on short-term price action may make it a better option for those interested in trading recent movements. As a versatile indicator, traders can use RSI to highlight potential reversals and trends through both its absolute value and divergences. This makes it ideal for someone looking to find specific entry and exit points rather than general market trends or long-term outperformance.
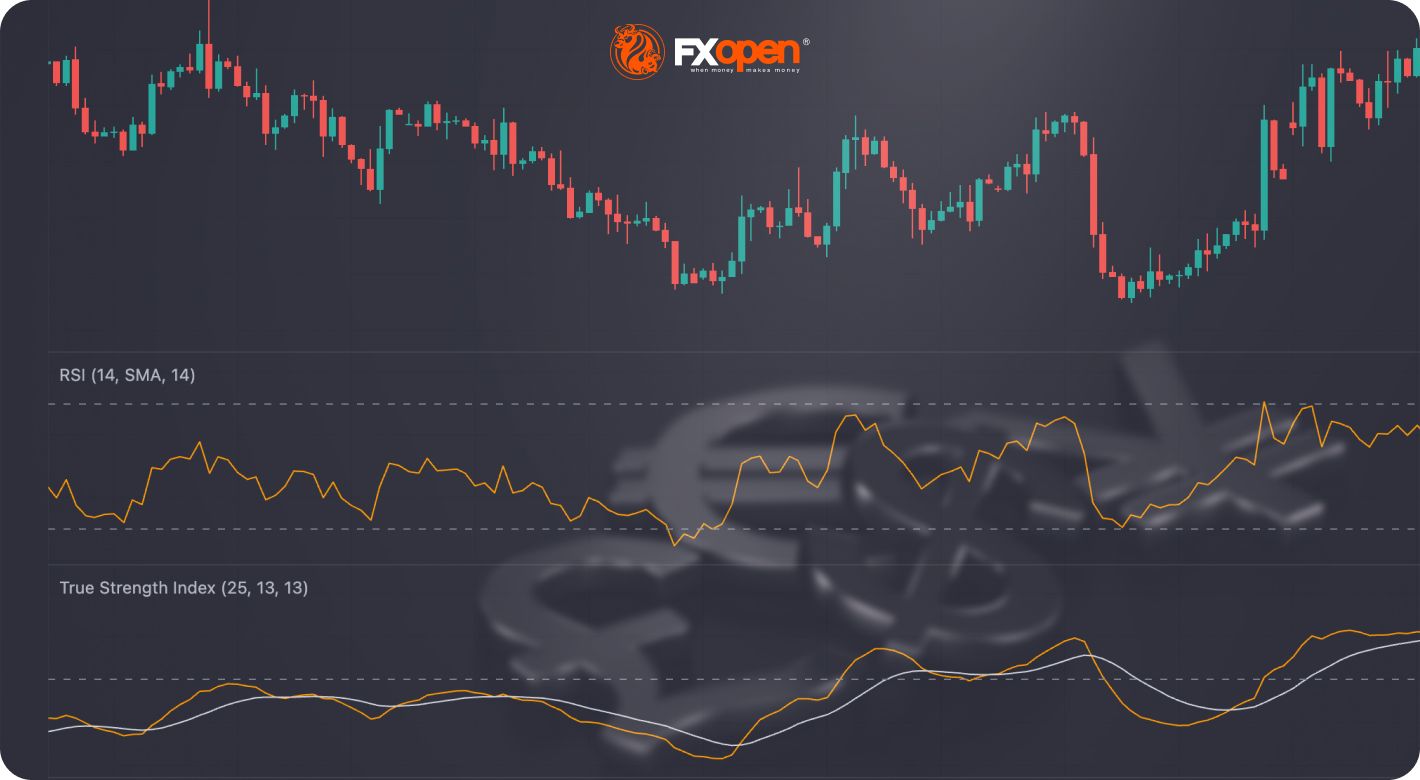
Relative Strength Index vs True Strength Indicator: What Is the Difference?
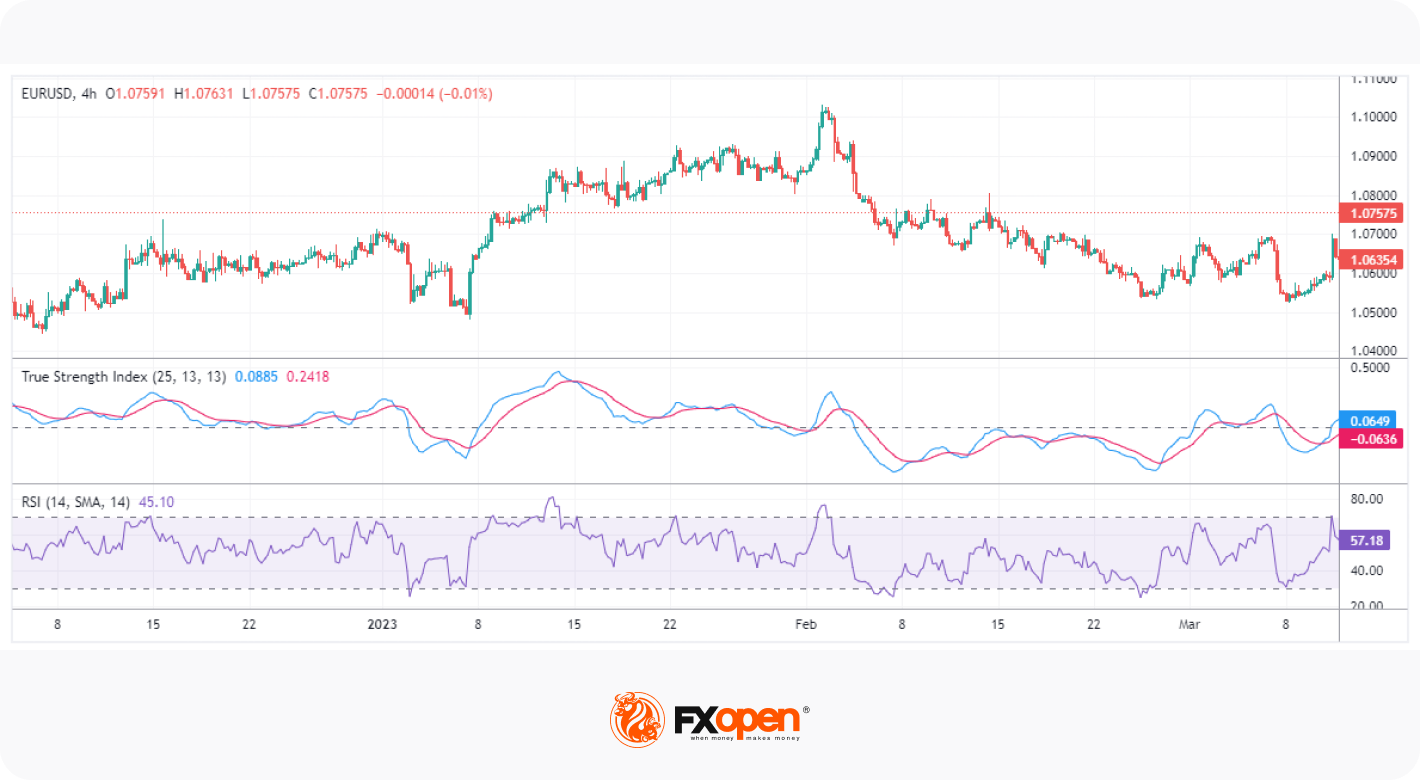
The True Strength Index (TSI) indicator is another momentum oscillator commonly confused with RSI. It’s calculated by smoothing price differences over a specific period and dividing the result by a double-smoothed average of the absolute price differences.
The resulting TSI value oscillates around a zero line, with positive values indicating bullish momentum and vice versa. It also features a signal line, which is an average of the TSI line.
While their plots are relatively similar, there are differences between RSI and TSI. The primary difference is in their interpretation. RSI mainly identifies overbought and oversold levels, while TSI indicates the overall trend direction using its value relative to the zero line. Their calculations also differ, resulting in a smoother TSI compared to the more erratic RSI.
Test Your Skills
Now that you have a solid overview of the differences between Relative Strength and RSI, it’s time to put your knowledge into action. You can open an FXOpen account to gain access to dozens of tradeable instruments and advanced technical analysis tools, including the RSI indicator. Good luck!
This article represents the opinion of the Companies operating under the FXOpen brand only. It is not to be construed as an offer, solicitation, or recommendation with respect to products and services provided by the Companies operating under the FXOpen brand, nor is it to be considered financial advice.
Stay ahead of the market!
Subscribe now to our mailing list and receive the latest market news and insights delivered directly to your inbox.

Latest articles

GBP/USD: Consolidation Ahead of the Bank of England Decision
The Bank of England is due to hold its next policy meeting on 18 June. According to a Reuters poll conducted between 5 and 12 June, all 65 economists surveyed expect the Bank Rate to remain unchanged at 3.75%

EUR/USD and GBP/USD Advance on Reports of a US–Iran Agreement
European currencies are staging a solid recovery after a period of heightened demand for the US dollar, which had previously been supported by geopolitical tensions in the Middle East. Reports that the United States and Iran have reached preliminary agreements

Weekly Market Insights with Gary Thomson: BoJ, Fed, and Geopolitics
In this video, we’ll explore the key economic events and market trends, shaping the financial landscape. Get ready for insights into financial markets to help you navigate the week ahead. Let’s dive in!
In this episode of Market