


EUR/USD, GBP/USD, and USD/JPY Analysis: Dollar Loses Gains Due to US Services Data
FXOpen
The dollar initially rose on Friday but then retreated after data showed the US services sector fell sharply in December, erasing gains made after a report showed stronger-than-expected nonfarm payrolls last month. Earlier in the session, the dollar jumped after data showed the US economy added 216,000 new jobs in December, topping the consensus forecast of 170,000. The Institute for Supply Management (ISM) said its non-manufacturing index fell to 50.6 last month, the lowest since May, down from 52.7 in November. The service sector makes up more than two-thirds of the economy. Economists polled by Reuters had forecast the index would change little to 52.6.
EUR/USD
The EUR/USD pair is trading around the 1.0940 level. According to EUR/USD technical analysis, immediate resistance can be seen at 1.1000, a break higher could trigger a move towards 1.1045. On the downside, immediate support is seen at 1.0918, a break below could take the pair towards 1.0875. The eurozone reported lower-than-expected consumer price index data (2.9% vs. 3.0%).
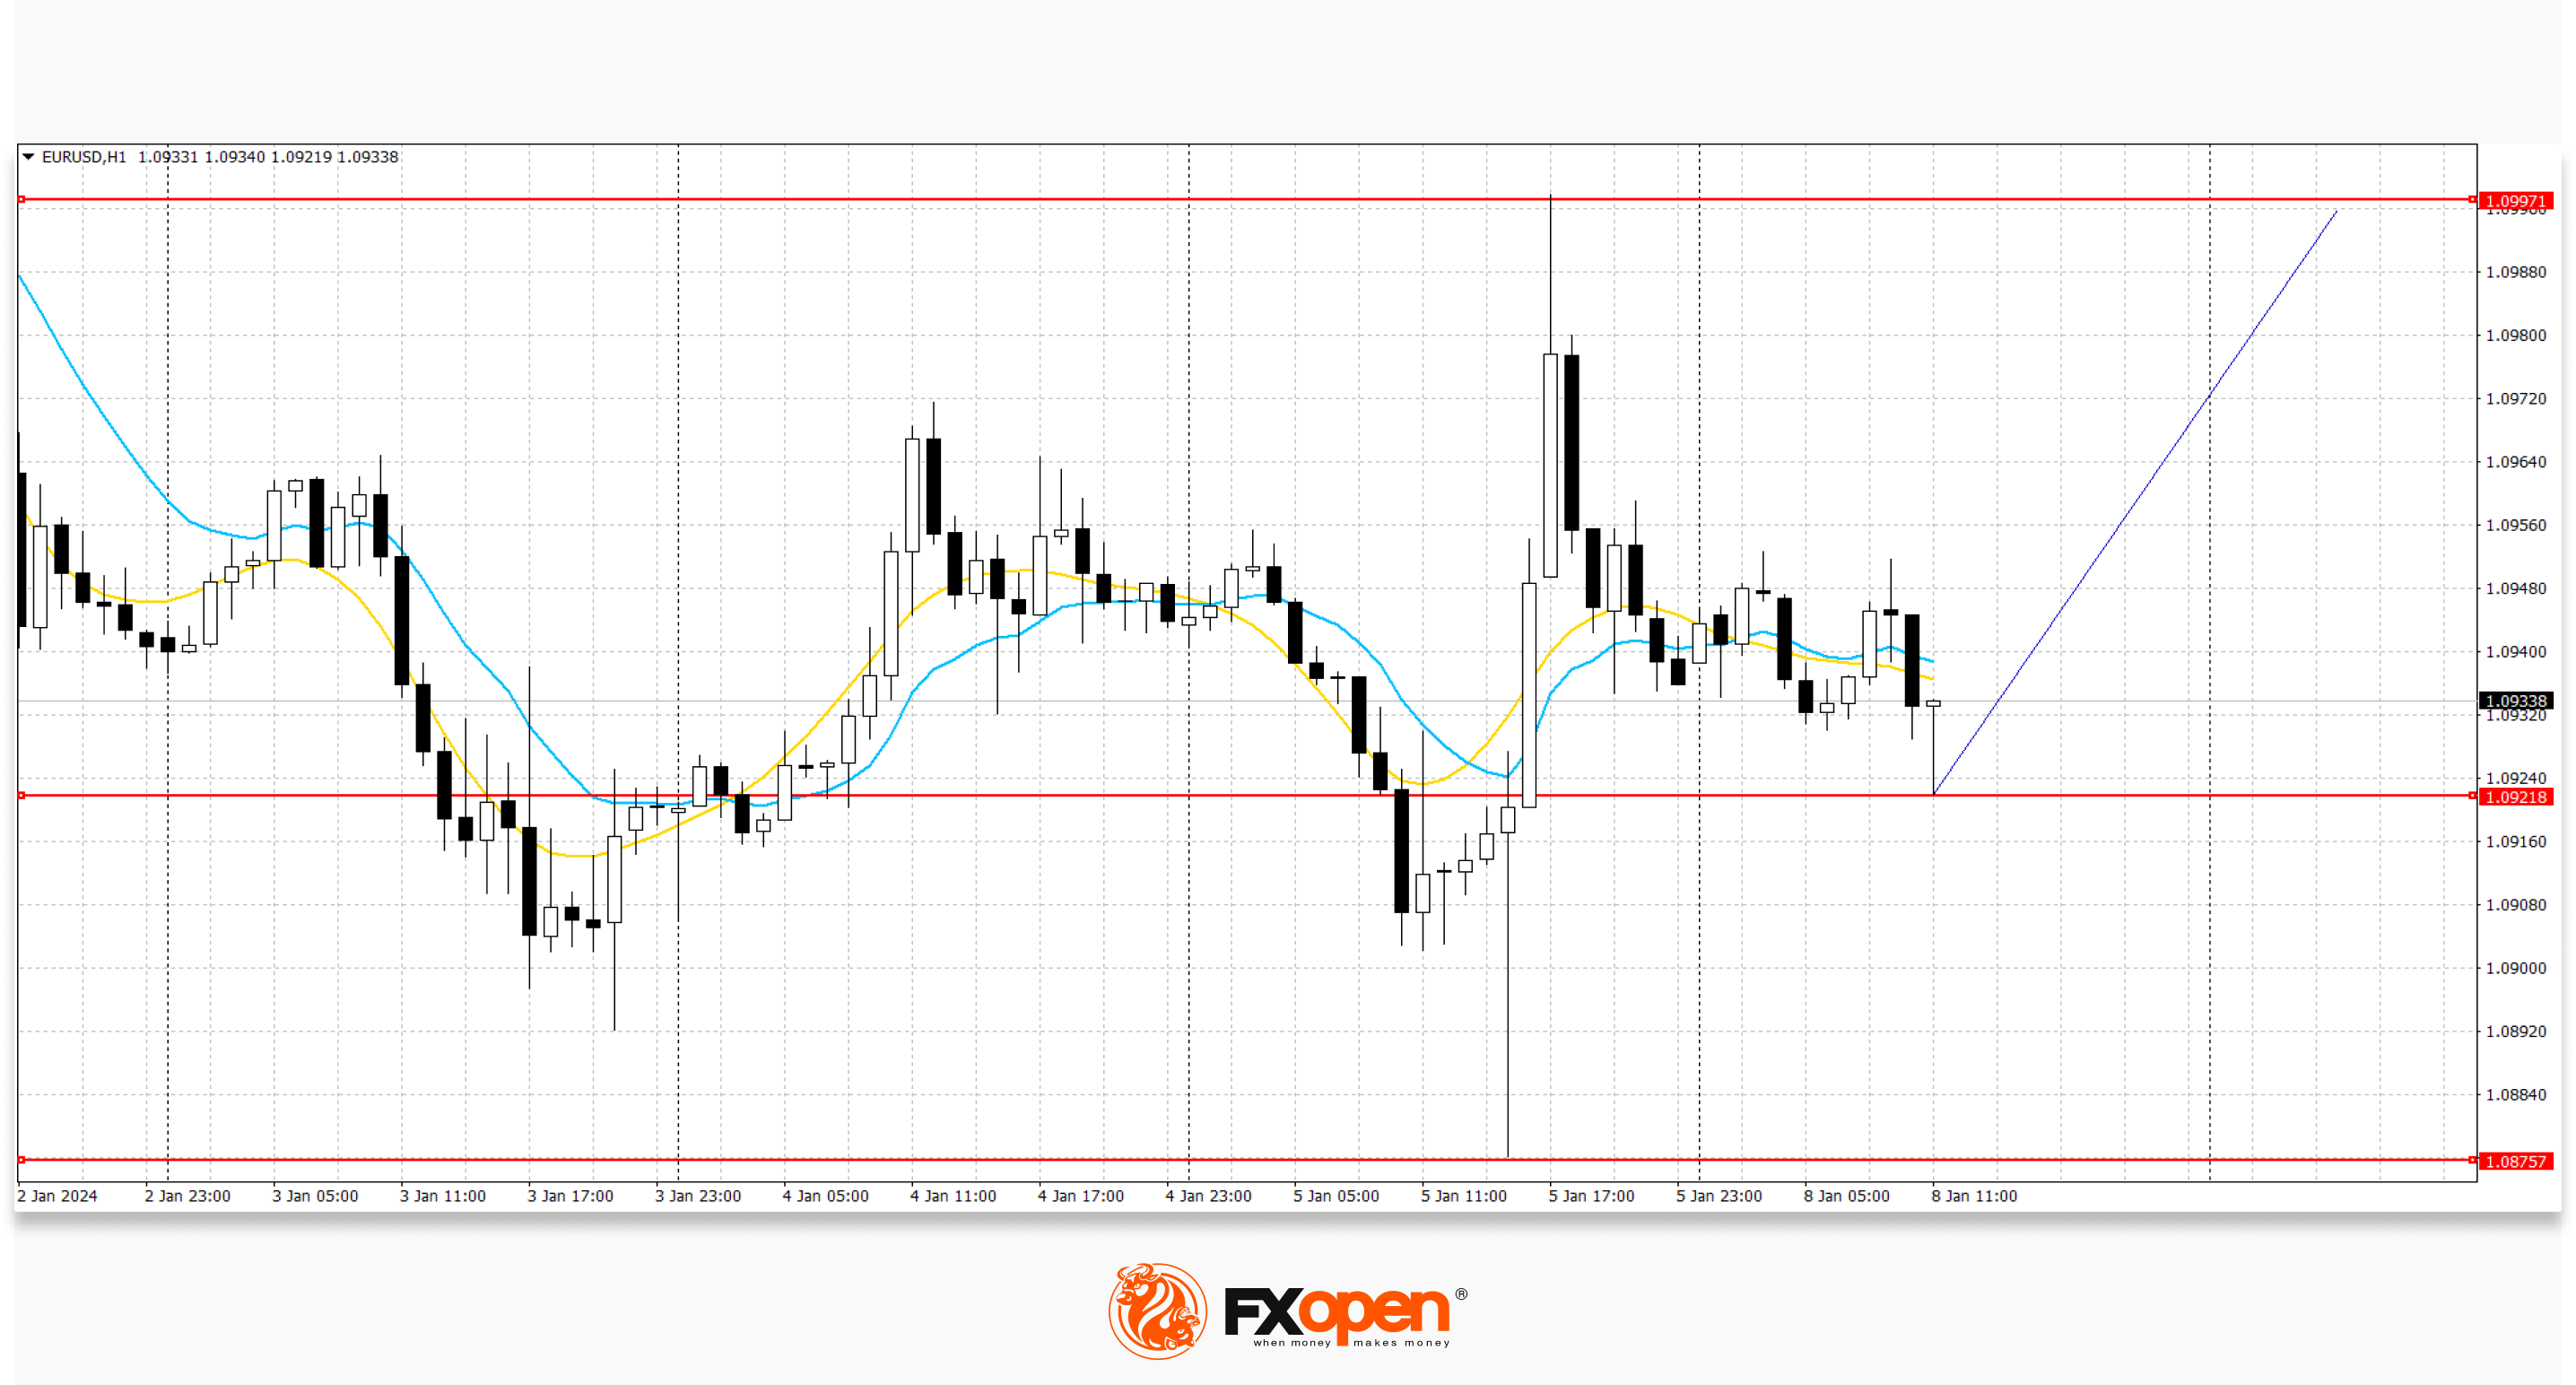
Over the past week, a trading range has formed with boundaries of 1.0875 and 1.1000. Now the price is in the middle of the range and may continue to rise.
GBP/USD
The GBP/USD pair has declined today and is trading around 1.2690. On the GBP/USD chart, immediate resistance can be seen at 1.2770, a break higher could trigger a rise towards 1.2826. On the downside, immediate support is seen at 1.2673, a break below could take the pair towards 1.2610. There is no important economic data on the British currency; the pair is influenced by American news.
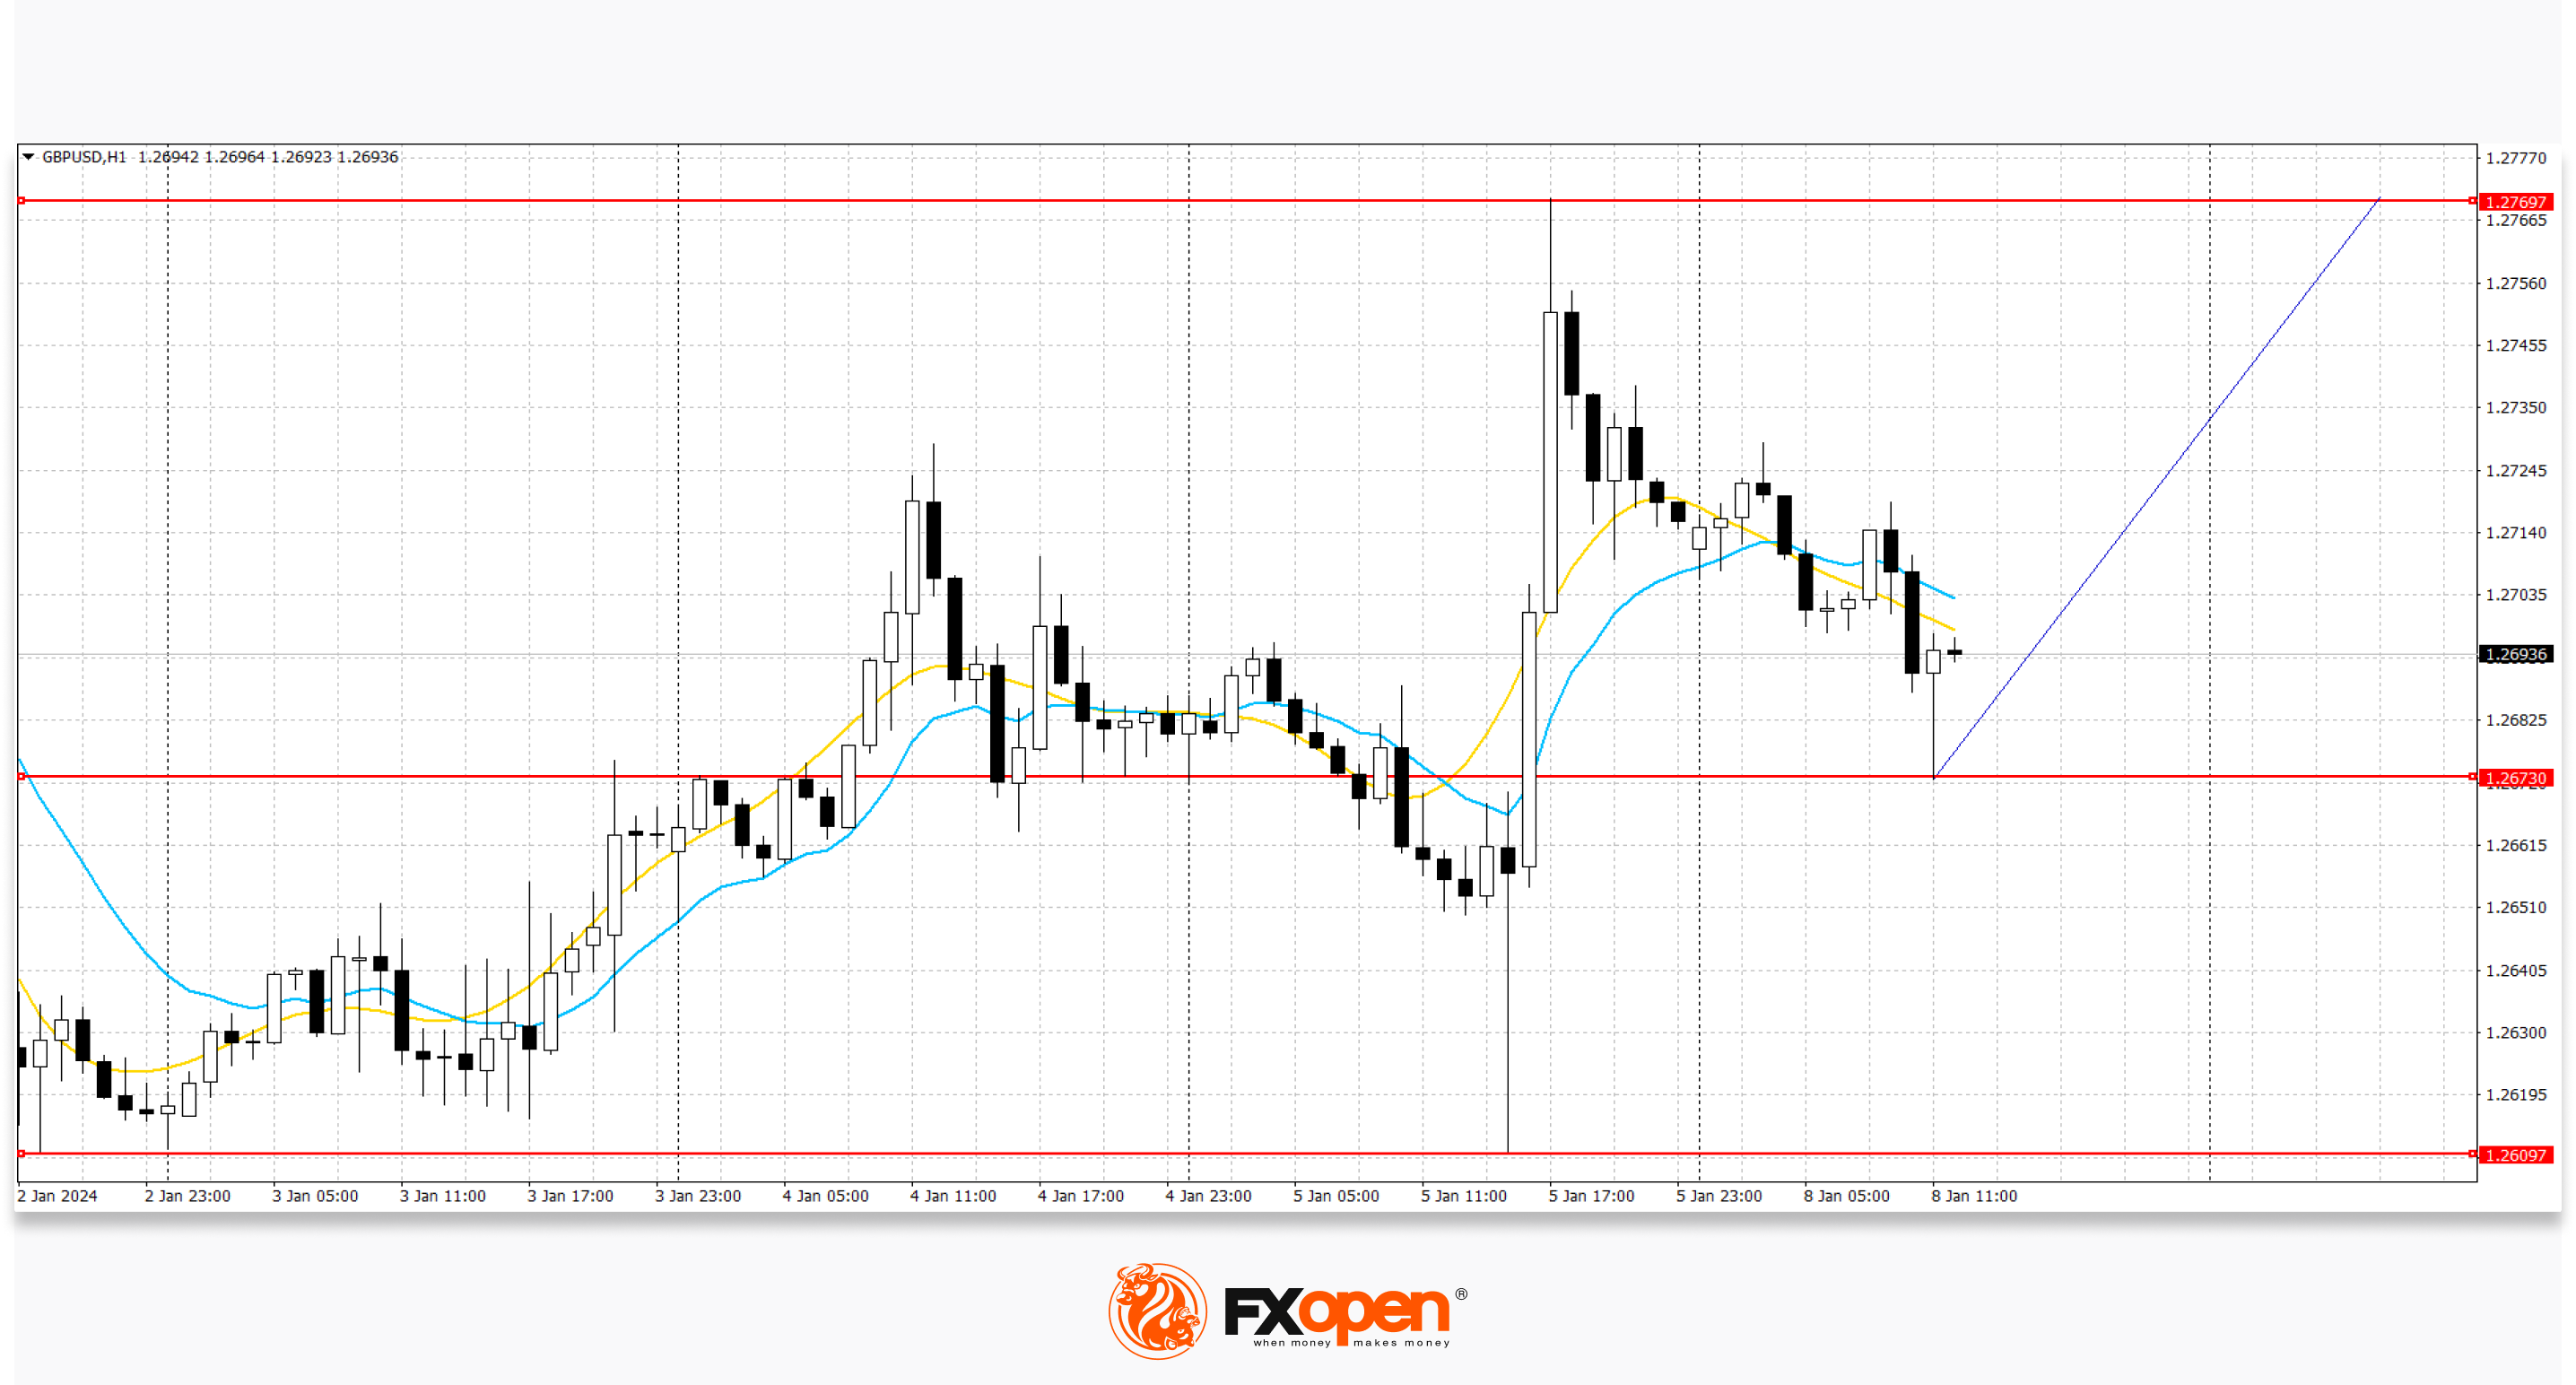
Over the past week, a trading range has formed with boundaries of 1.2610 and 1.2770. Now the price is in the middle of the range and may continue to rise.
USD/JPY
Against the backdrop of the stabilisation of the American dollar, the USD/JPY pair is correcting around the level of 144.30, despite positive Japanese macroeconomic statistics. On the USD/JPY chart, strong resistance can be seen at 145.95, a break higher could trigger a rise towards 146.56. On the downside, immediate support is seen at 143.73. A break below could take the pair towards 142.84.
Japan's services business activity index increased from 50.8 points to 51.5 points in December, in line with autumn parameters, and the household confidence index increased from 36.1 points to 37.2 points, the highest since December 2022. Tomorrow, the November household spending indicator will be published, which is expected to rise by 0.2% month-on-month, driving an annual correction from -2.5% to -2.3%, as well as the core consumer price indicator in Tokyo, reflecting the dynamics of inflation throughout the country: in December it may drop from 2.3% to 2.1%.
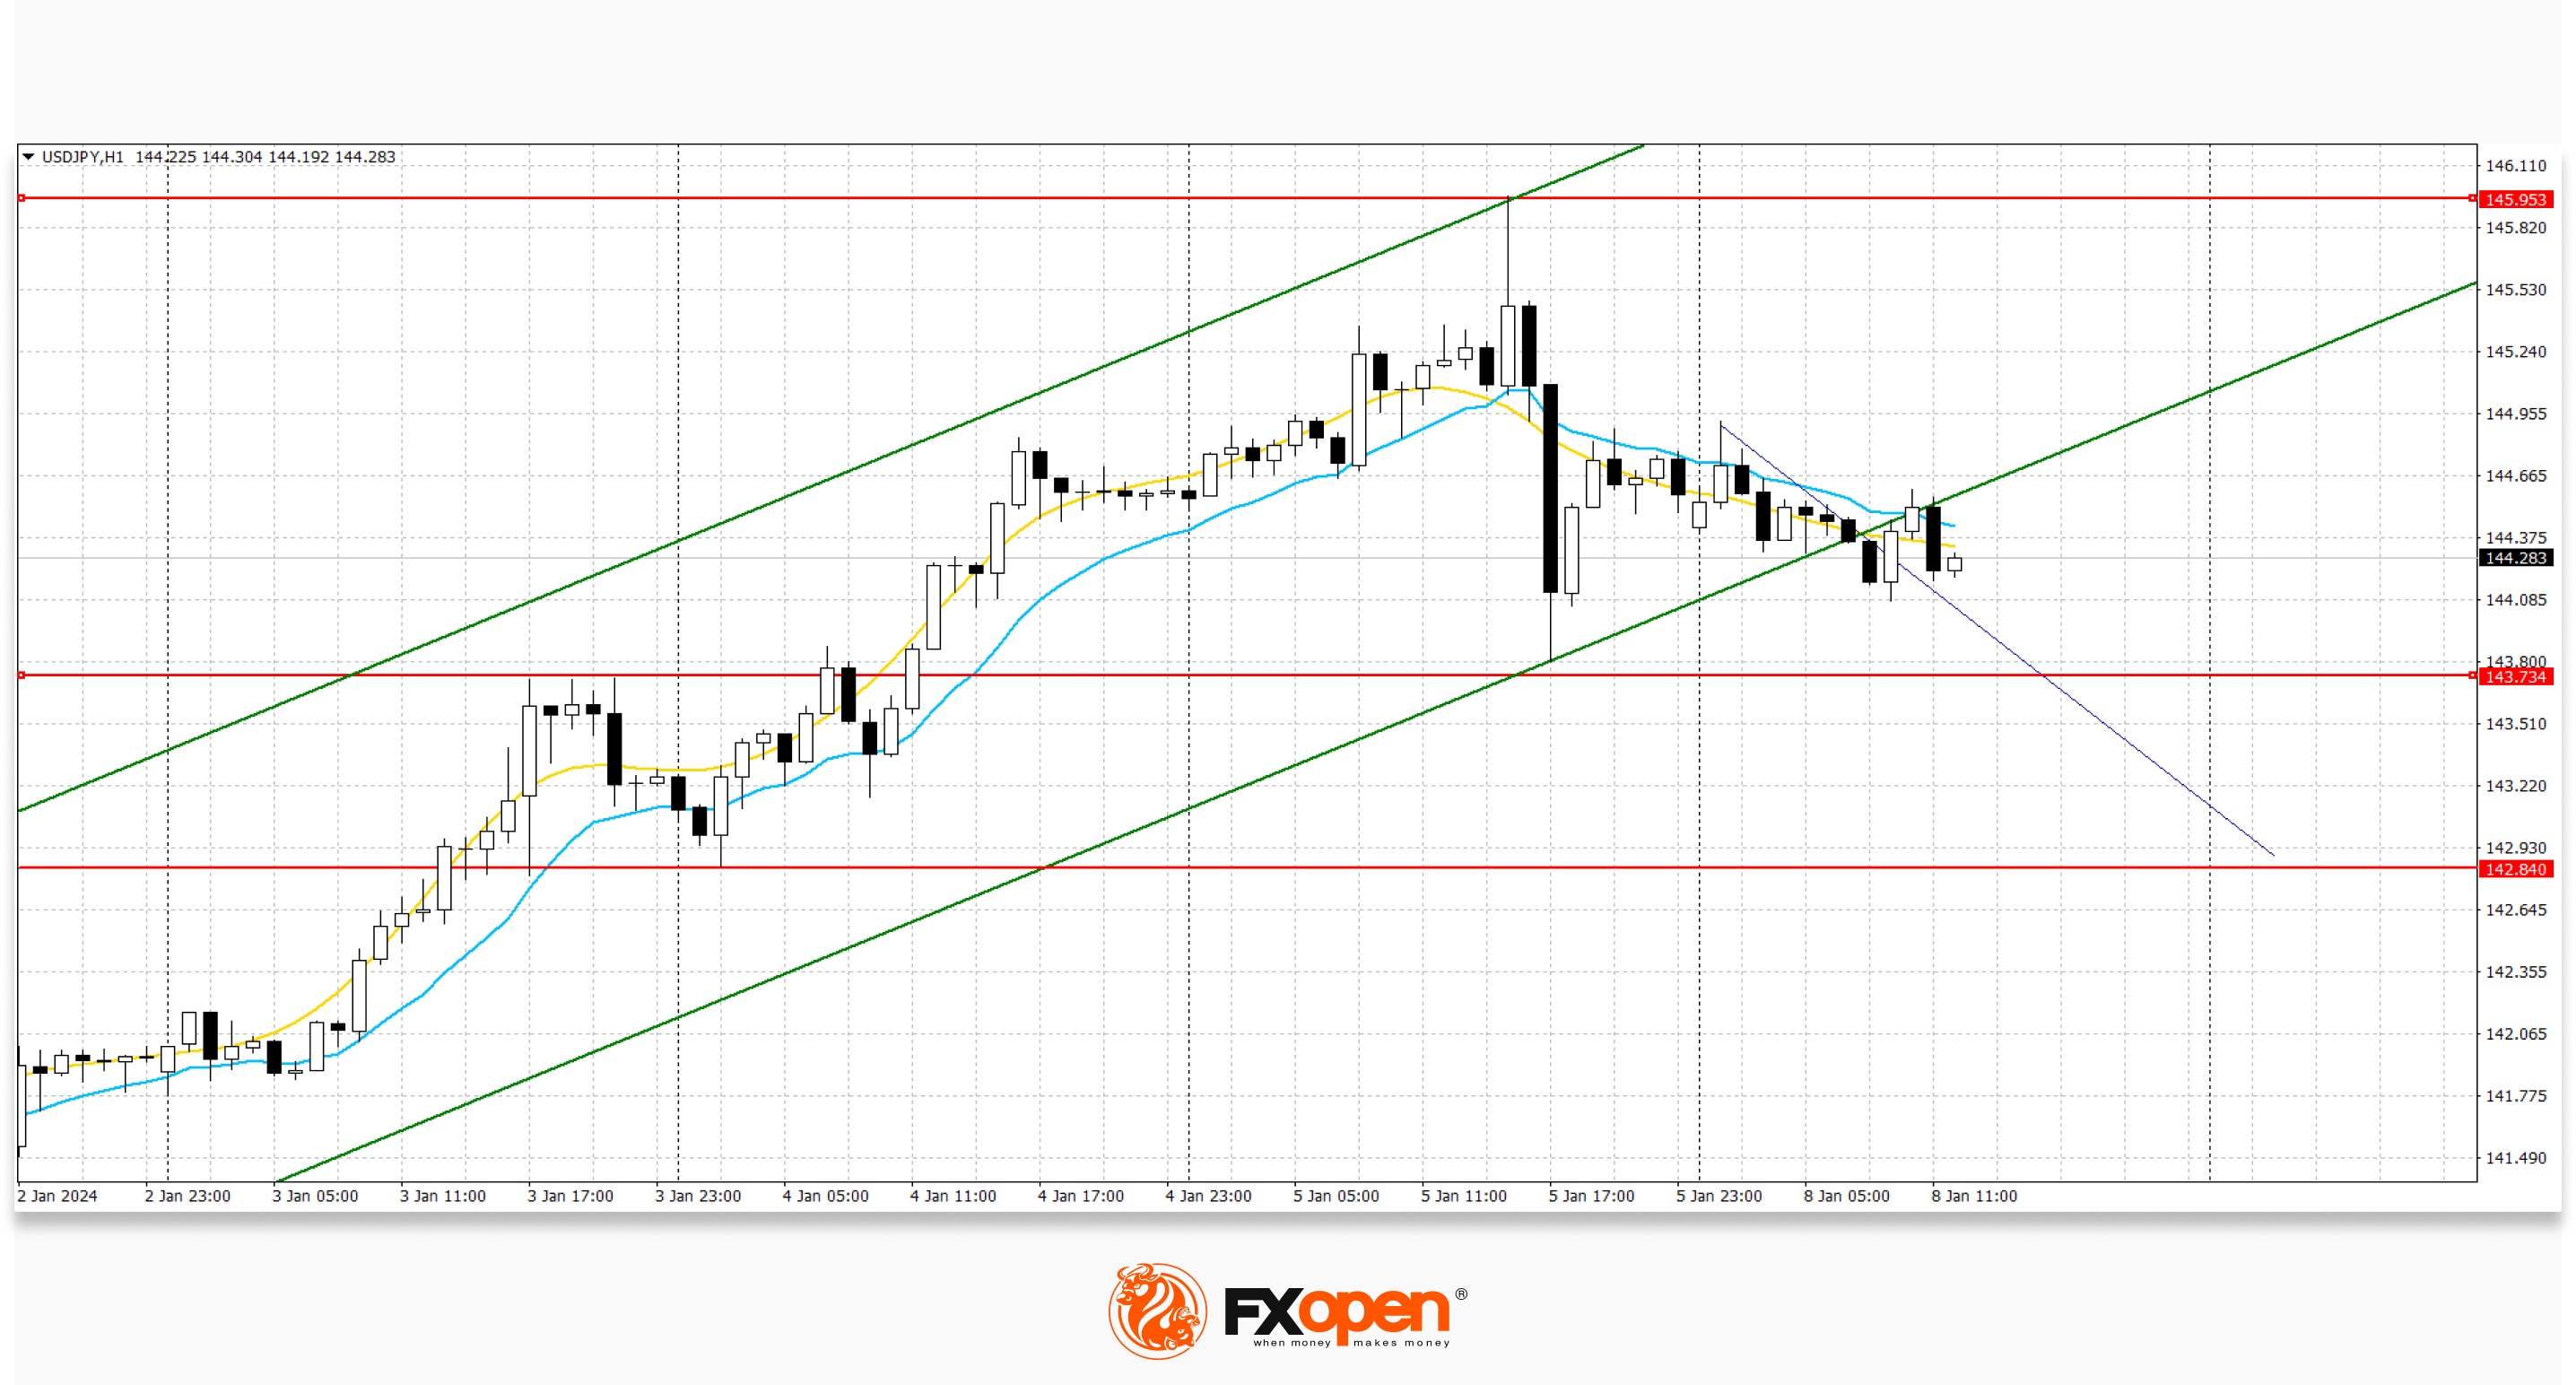
The price has broken through the lower boundary of the ascending channel and may continue to decline.
Trade over 50 forex markets 24 hours a day with FXOpen. Take advantage of low commissions, deep liquidity, and spreads from 0.0 pips (additional fees may apply). Open your FXOpen account now or learn more about trading forex with FXOpen.
This article represents the opinion of the Companies operating under the FXOpen brand only. It is not to be construed as an offer, solicitation, or recommendation with respect to products and services provided by the Companies operating under the FXOpen brand, nor is it to be considered financial advice.
Stay ahead of the market!
Subscribe now to our mailing list and receive the latest market news and insights delivered directly to your inbox.


Latest articles

AI Valuations Are Back in the Spotlight
Artificial intelligence remains the dominant investment theme of 2026, but investors are increasingly questioning whether AI stock valuations are keeping pace with reality.
💰 Big Tech continues to invest at an unprecedented scale, with hyperscaler AI spending projected to exceed $800

AUD/CAD: Months of Indecision — Is a Breakout Finally Coming?
The Australian dollar has clawed back most of its end-of-June losses, when it touched three-month lows against the greenback amid escalating Middle East tensions. Since then, sentiment has improved: the RBA's Assistant Governor Sarah Hunter signalled the board stands ready

USD/JPY: Battling at the Top of the Triangle
On 3 July, Japan's Finance Minister, Satsuki Katayama, stated that the Ministry of Finance remains in close contact with US authorities regarding developments in USD/JPY as the yen traded near its weakest level in almost 40 years. Similar verbal