


FXOpen

Last week, markets analyzed the results of the speech of US Federal Reserve Chairman Jerome Powell at a meeting organized by the International Monetary Fund (IMF). Representatives of the American regulator doubt that borrowing costs have reached their peak. Thus, the head of the US Federal Reserve noted that he fully admits one or more interest rate increases if the current economic situation requires it. Officials supported the idea of a possible tightening of monetary conditions if the rate of decline in inflation lags behind expectations. At the same time, the department is aware of the additional risks that a further increase in borrowing costs brings with it, but considers the American economy to be quite stable. In addition, on Friday, investors were disappointed by data on the consumer confidence index from the University of Michigan: in November, the indicator fell sharply from 63.8 points to 60.4 points, while the forecast was 63.7 points. Today in the United States the October report on federal budget execution is expected to be published: forecasts suggest a significant reduction in the deficit from -$171.0 billion to -$30.0 billion.
EUR/USD
The EUR/USD pair shows mixed trading dynamics, consolidating near the 1.0685 mark. The immediate resistance can be seen at 1.0690, a breakout to the upside could trigger a rise towards 1.0711. On the downside, immediate support is seen at 1.0664, a break below could take the pair towards 1.0648.
On Friday, the single currency fell moderately, updating local lows from November 3 against the backdrop of statements by representatives of the US Federal Reserve regarding the prospects for monetary policy. Last Friday's European statistics also failed to significantly support buying sentiment in the market. Thus, industrial production in Italy showed zero dynamics in September after growing by 0.3% in the previous month, while analysts expected -0.2%, and in annual terms the figure rose from -4.2% to -2.0 %. The focus of investors' attention today will be a summary of economic forecasts from the European Commission.
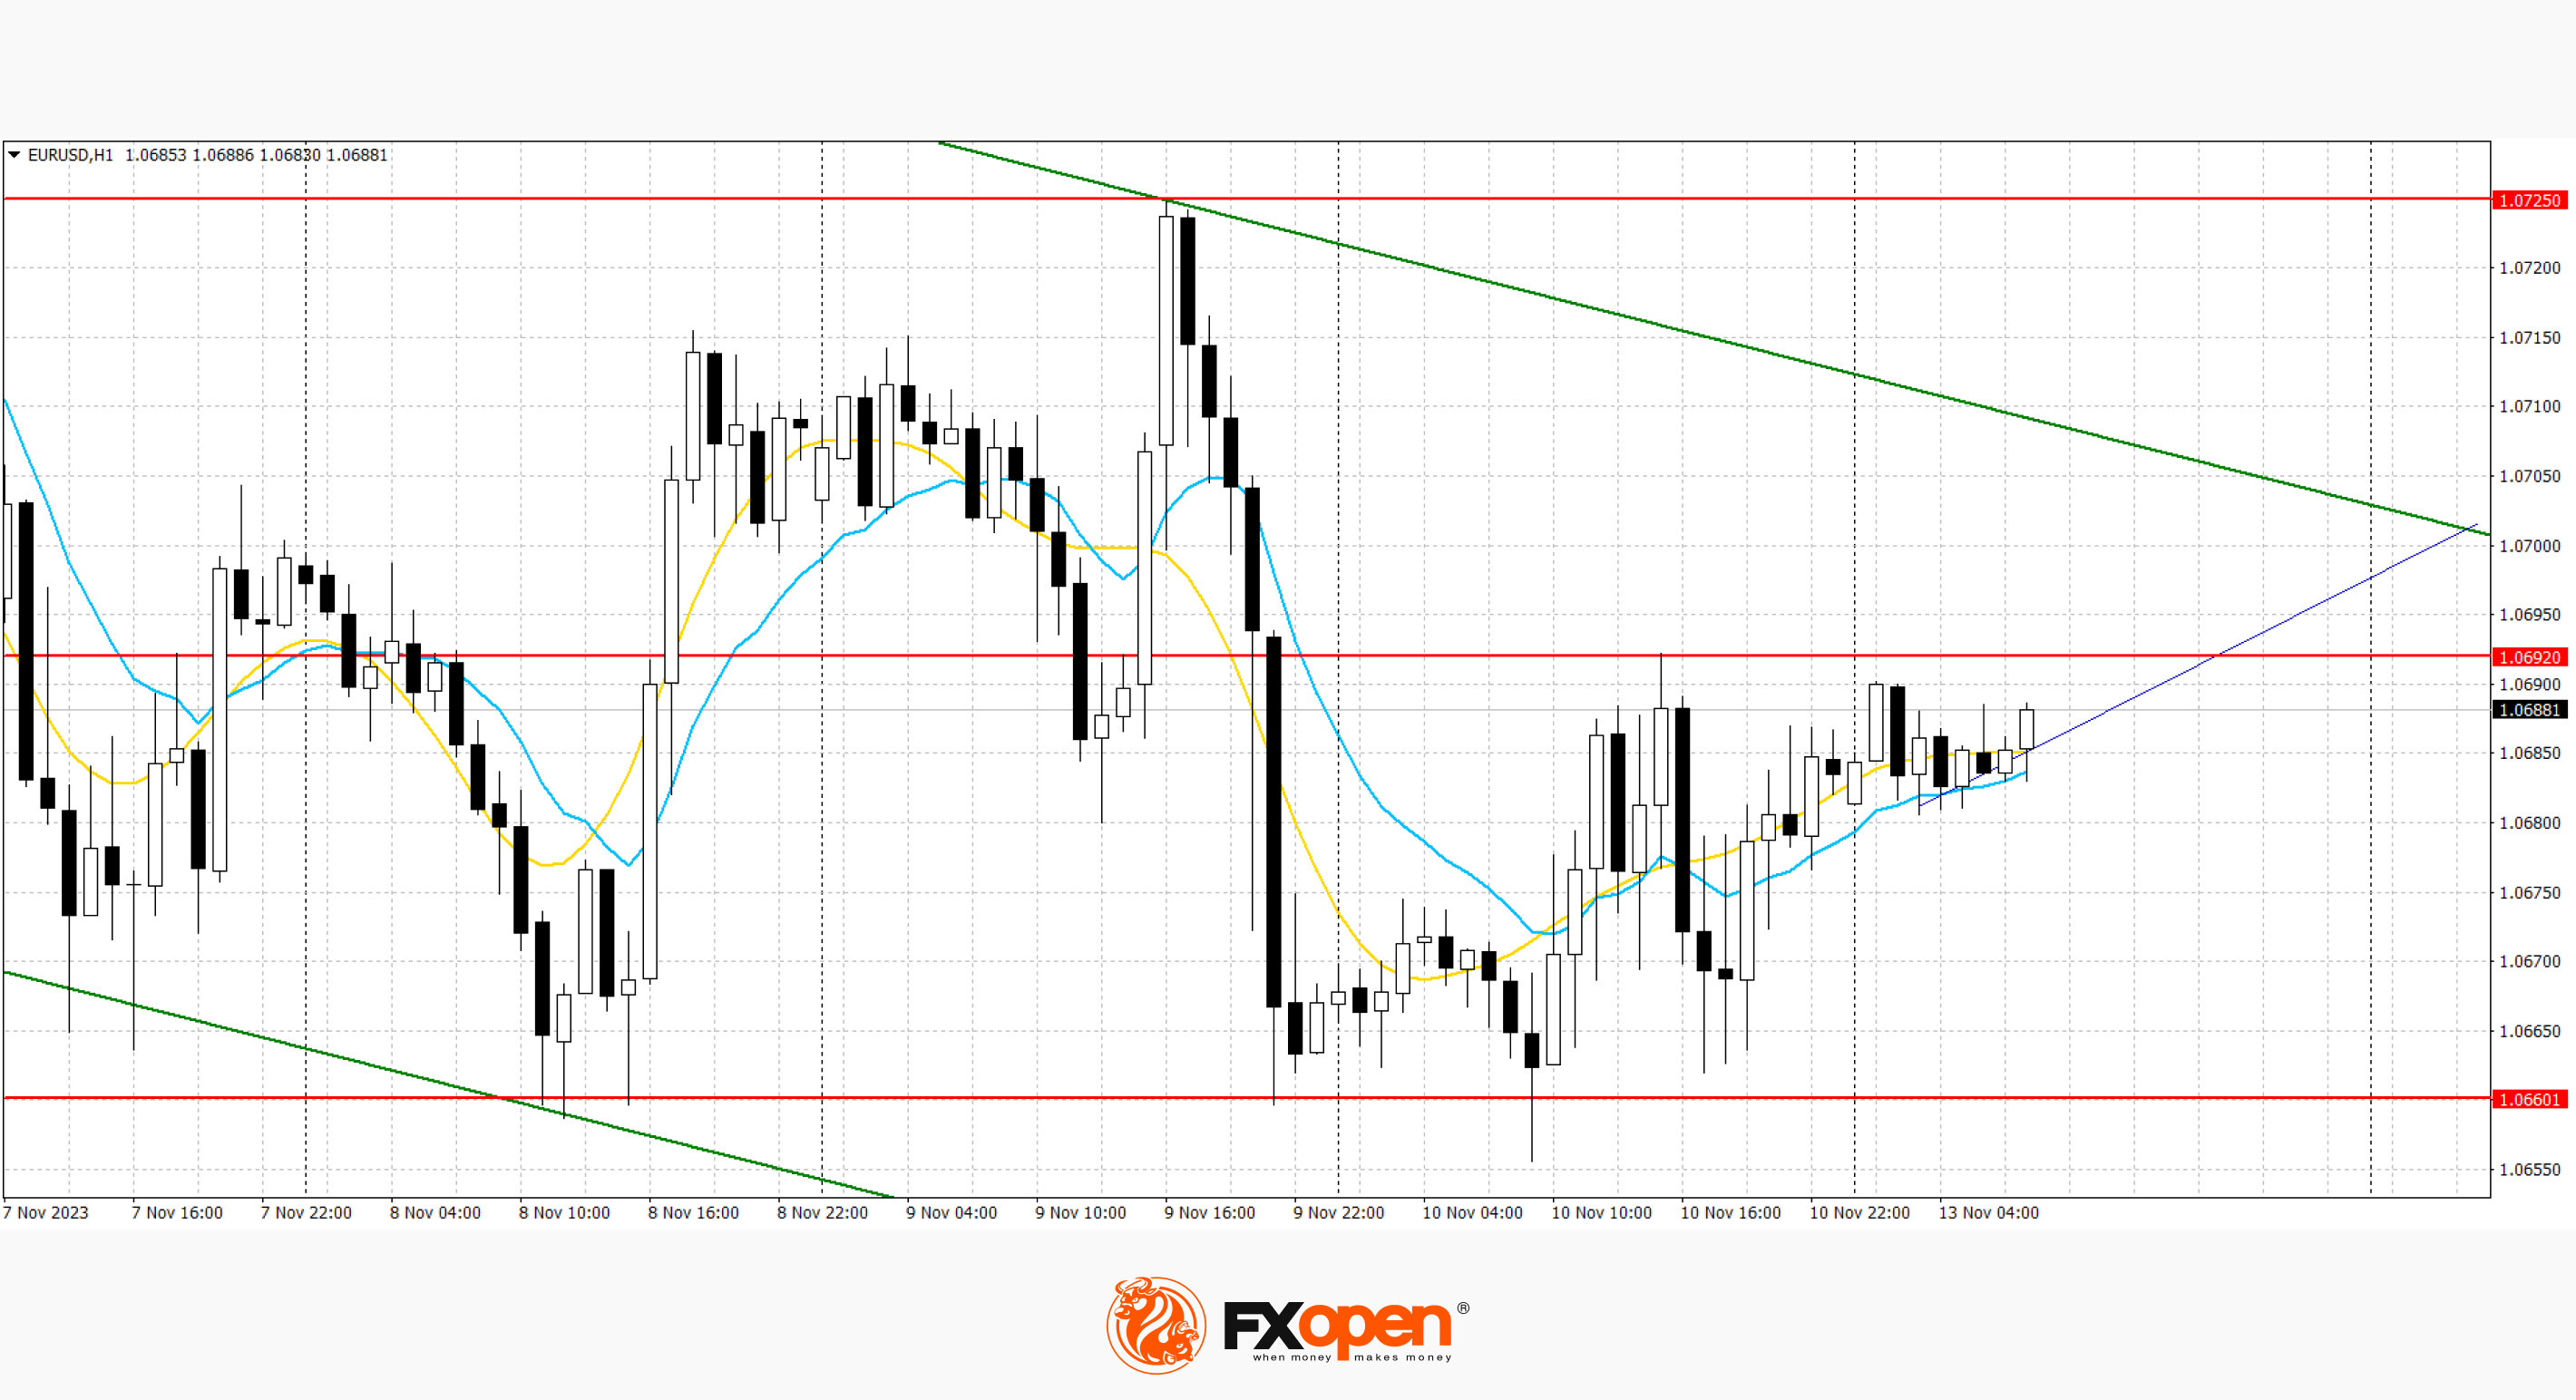
The previous downward channel remains. Now the price is approaching the upper border of the channel, from where it may continue to decline.
GBP/USD
The GBP/USD pair is showing moderate growth, trying to recover from a noticeable decline last week, when local lows from November 3 were updated. The nearest resistance can be seen at 1.2271, a break upward could trigger a rise to 1.2296. In the fall, the nearest support is seen at 1.2180, a break below could take the pair to 1.2138.
Data published last week showed UK GDP growth in September by 0.2%, up from 0.1% a month earlier, while analysts had expected -0.1%. The indicator in the third quarter showed zero dynamics, and in annual terms added 0.6%, which also turned out to be better than forecasts of -0.1% and 0.5%, respectively. Industrial production in September amounted to 0.0% after -0.5% in the previous month, while markets expected 0.1%, and in annual terms the figure was fixed at 1.5%, which was noticeably higher than expected level of 1.1%. Production in the manufacturing sector increased by 0.1% after -0.7% a month earlier, with a forecast of 0.3%.
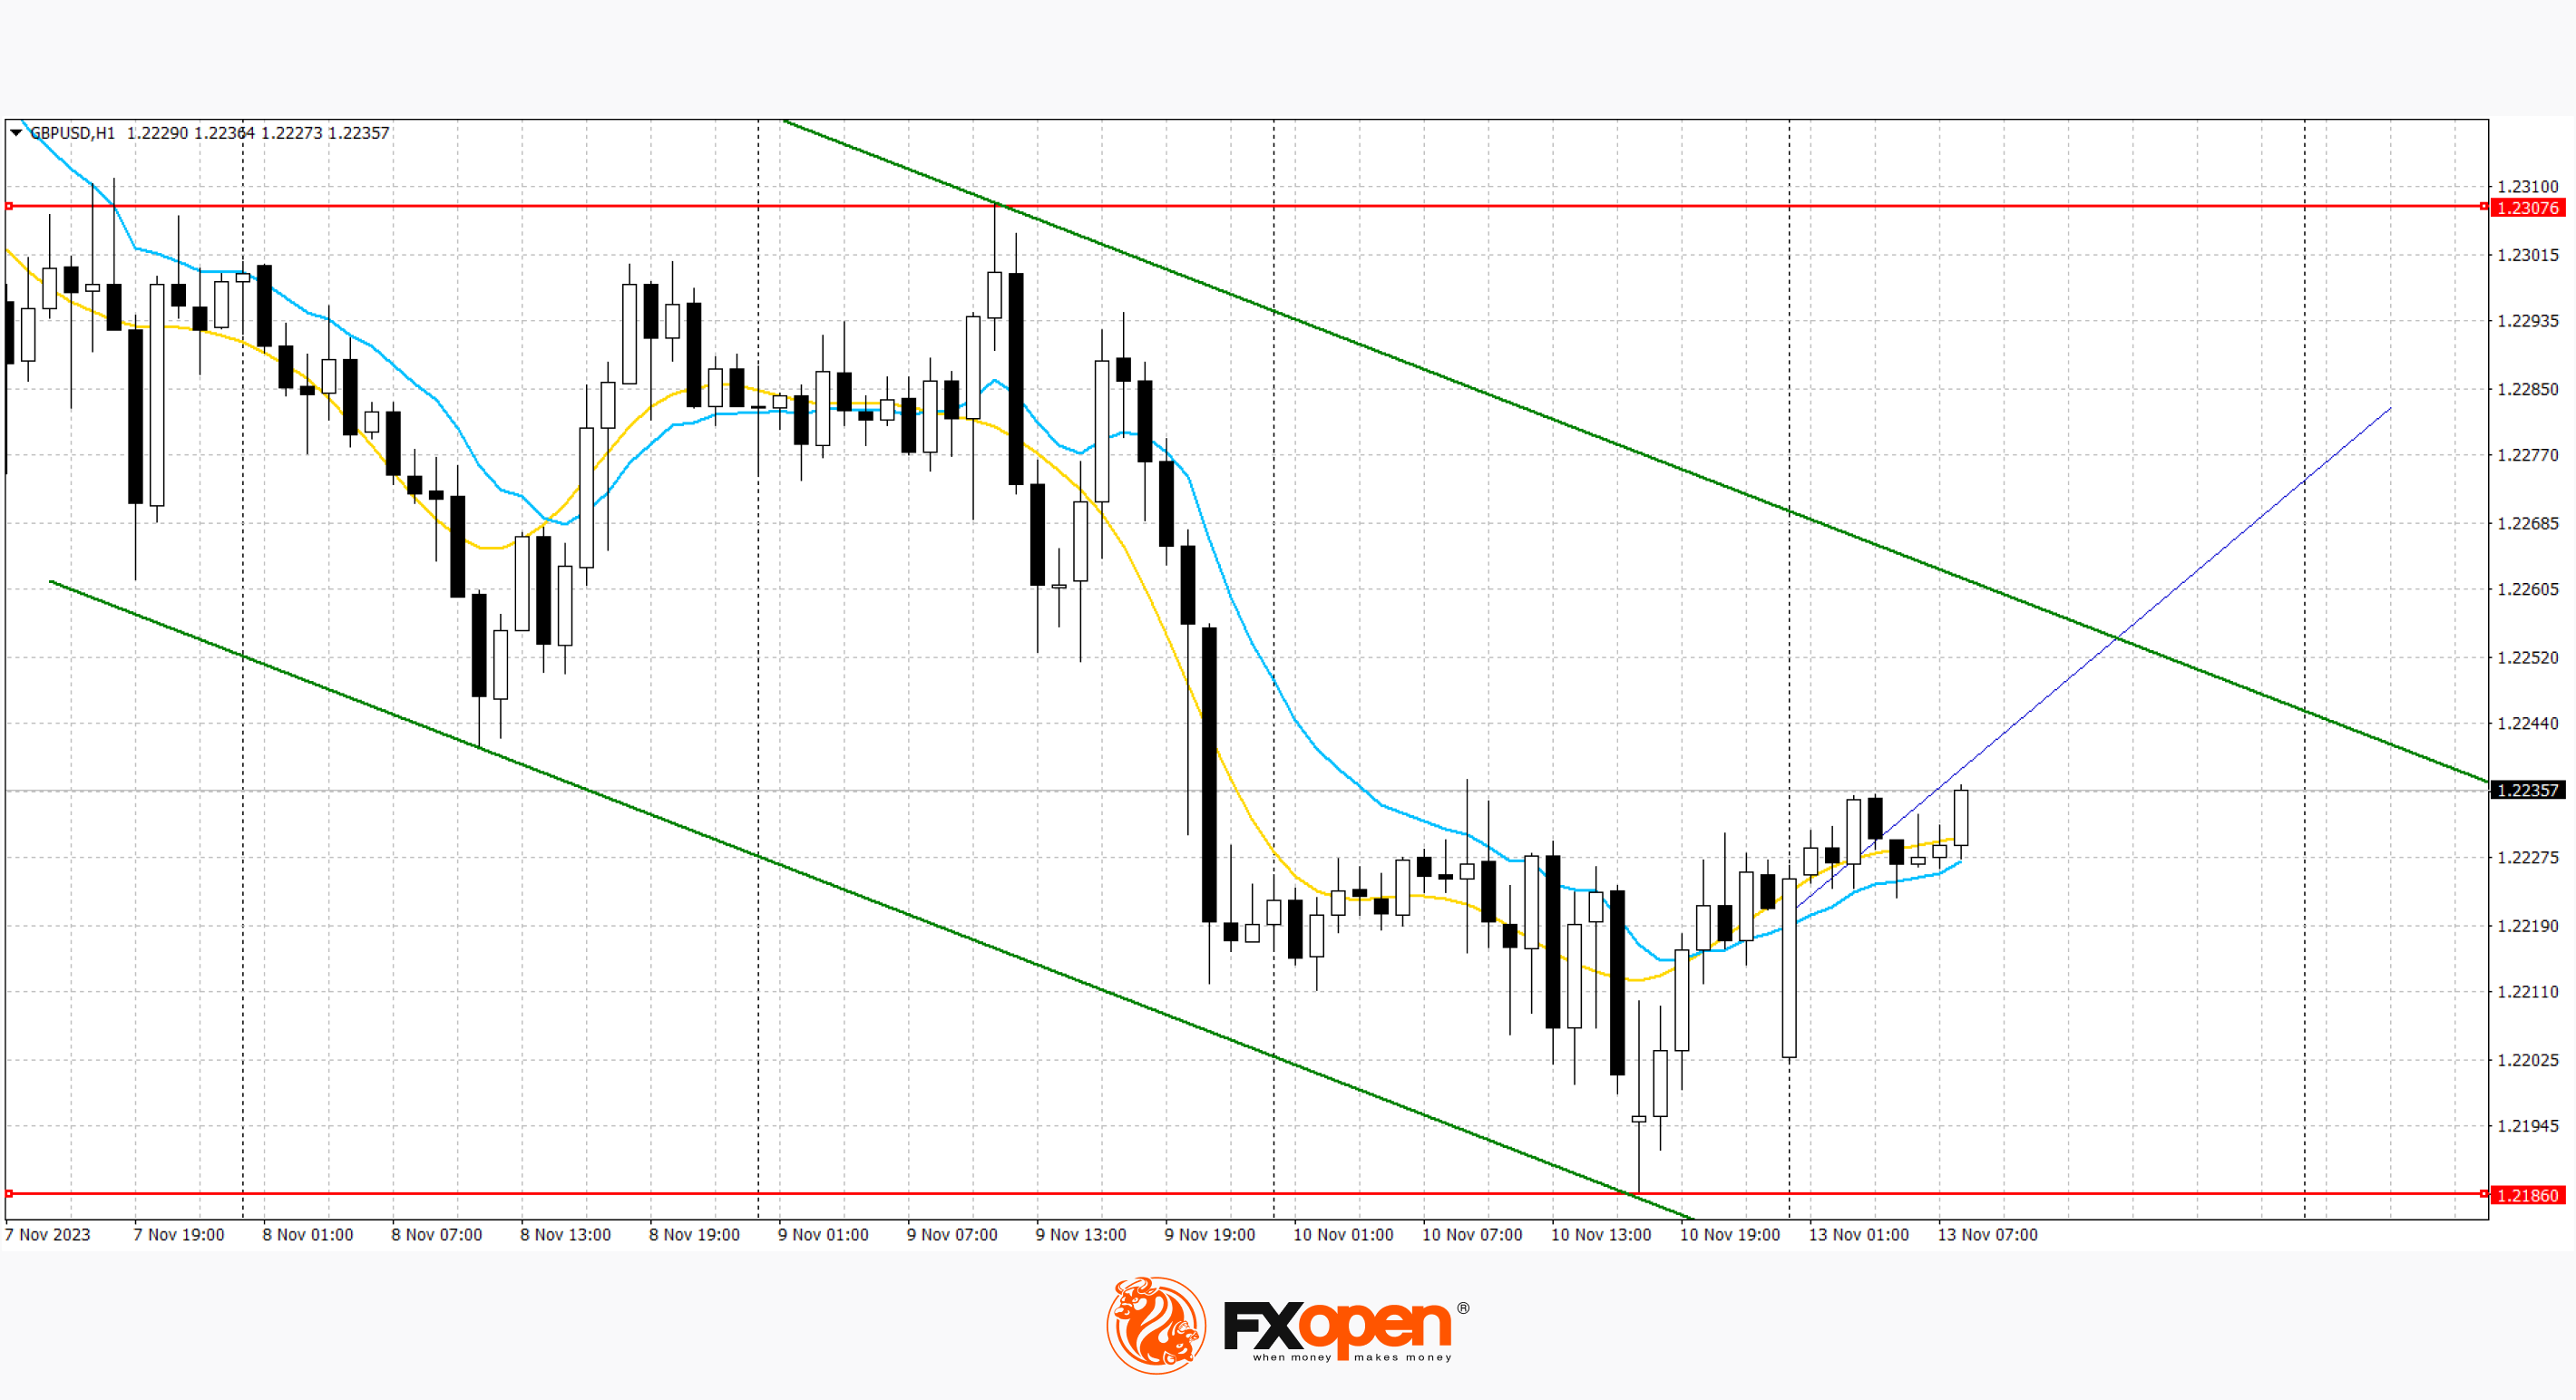
Based on last week's lows, a new downward channel has formed. Now the price is in the middle of the channel and may continue to move towards the upper border.
USD/JPY
The USD/JPY pair continues to rise moderately, developing the bullish dynamics formed last week. The dollar is testing the 151.70 mark for an upward breakout, updating record highs from October 21, 2022. Strong resistance can be seen at 151.66, a break higher could trigger a rise towards 152.07. On the downside, immediate support is seen at 151.18. A break below could take the pair towards 150.43.
The possibility of new currency interventions by the Bank of Japan only increases with the further weakening of the yen. Pressure on the yen is exerted by data from Japan: thus, the producer price index in October amounted to -0.4% after -0.3% in the previous month, while analysts expected zero dynamics, and the domestic price index for corporate goods slowed down from 2 .0% to 0.8%, which also turned out to be lower than the forecast of 0.9%.
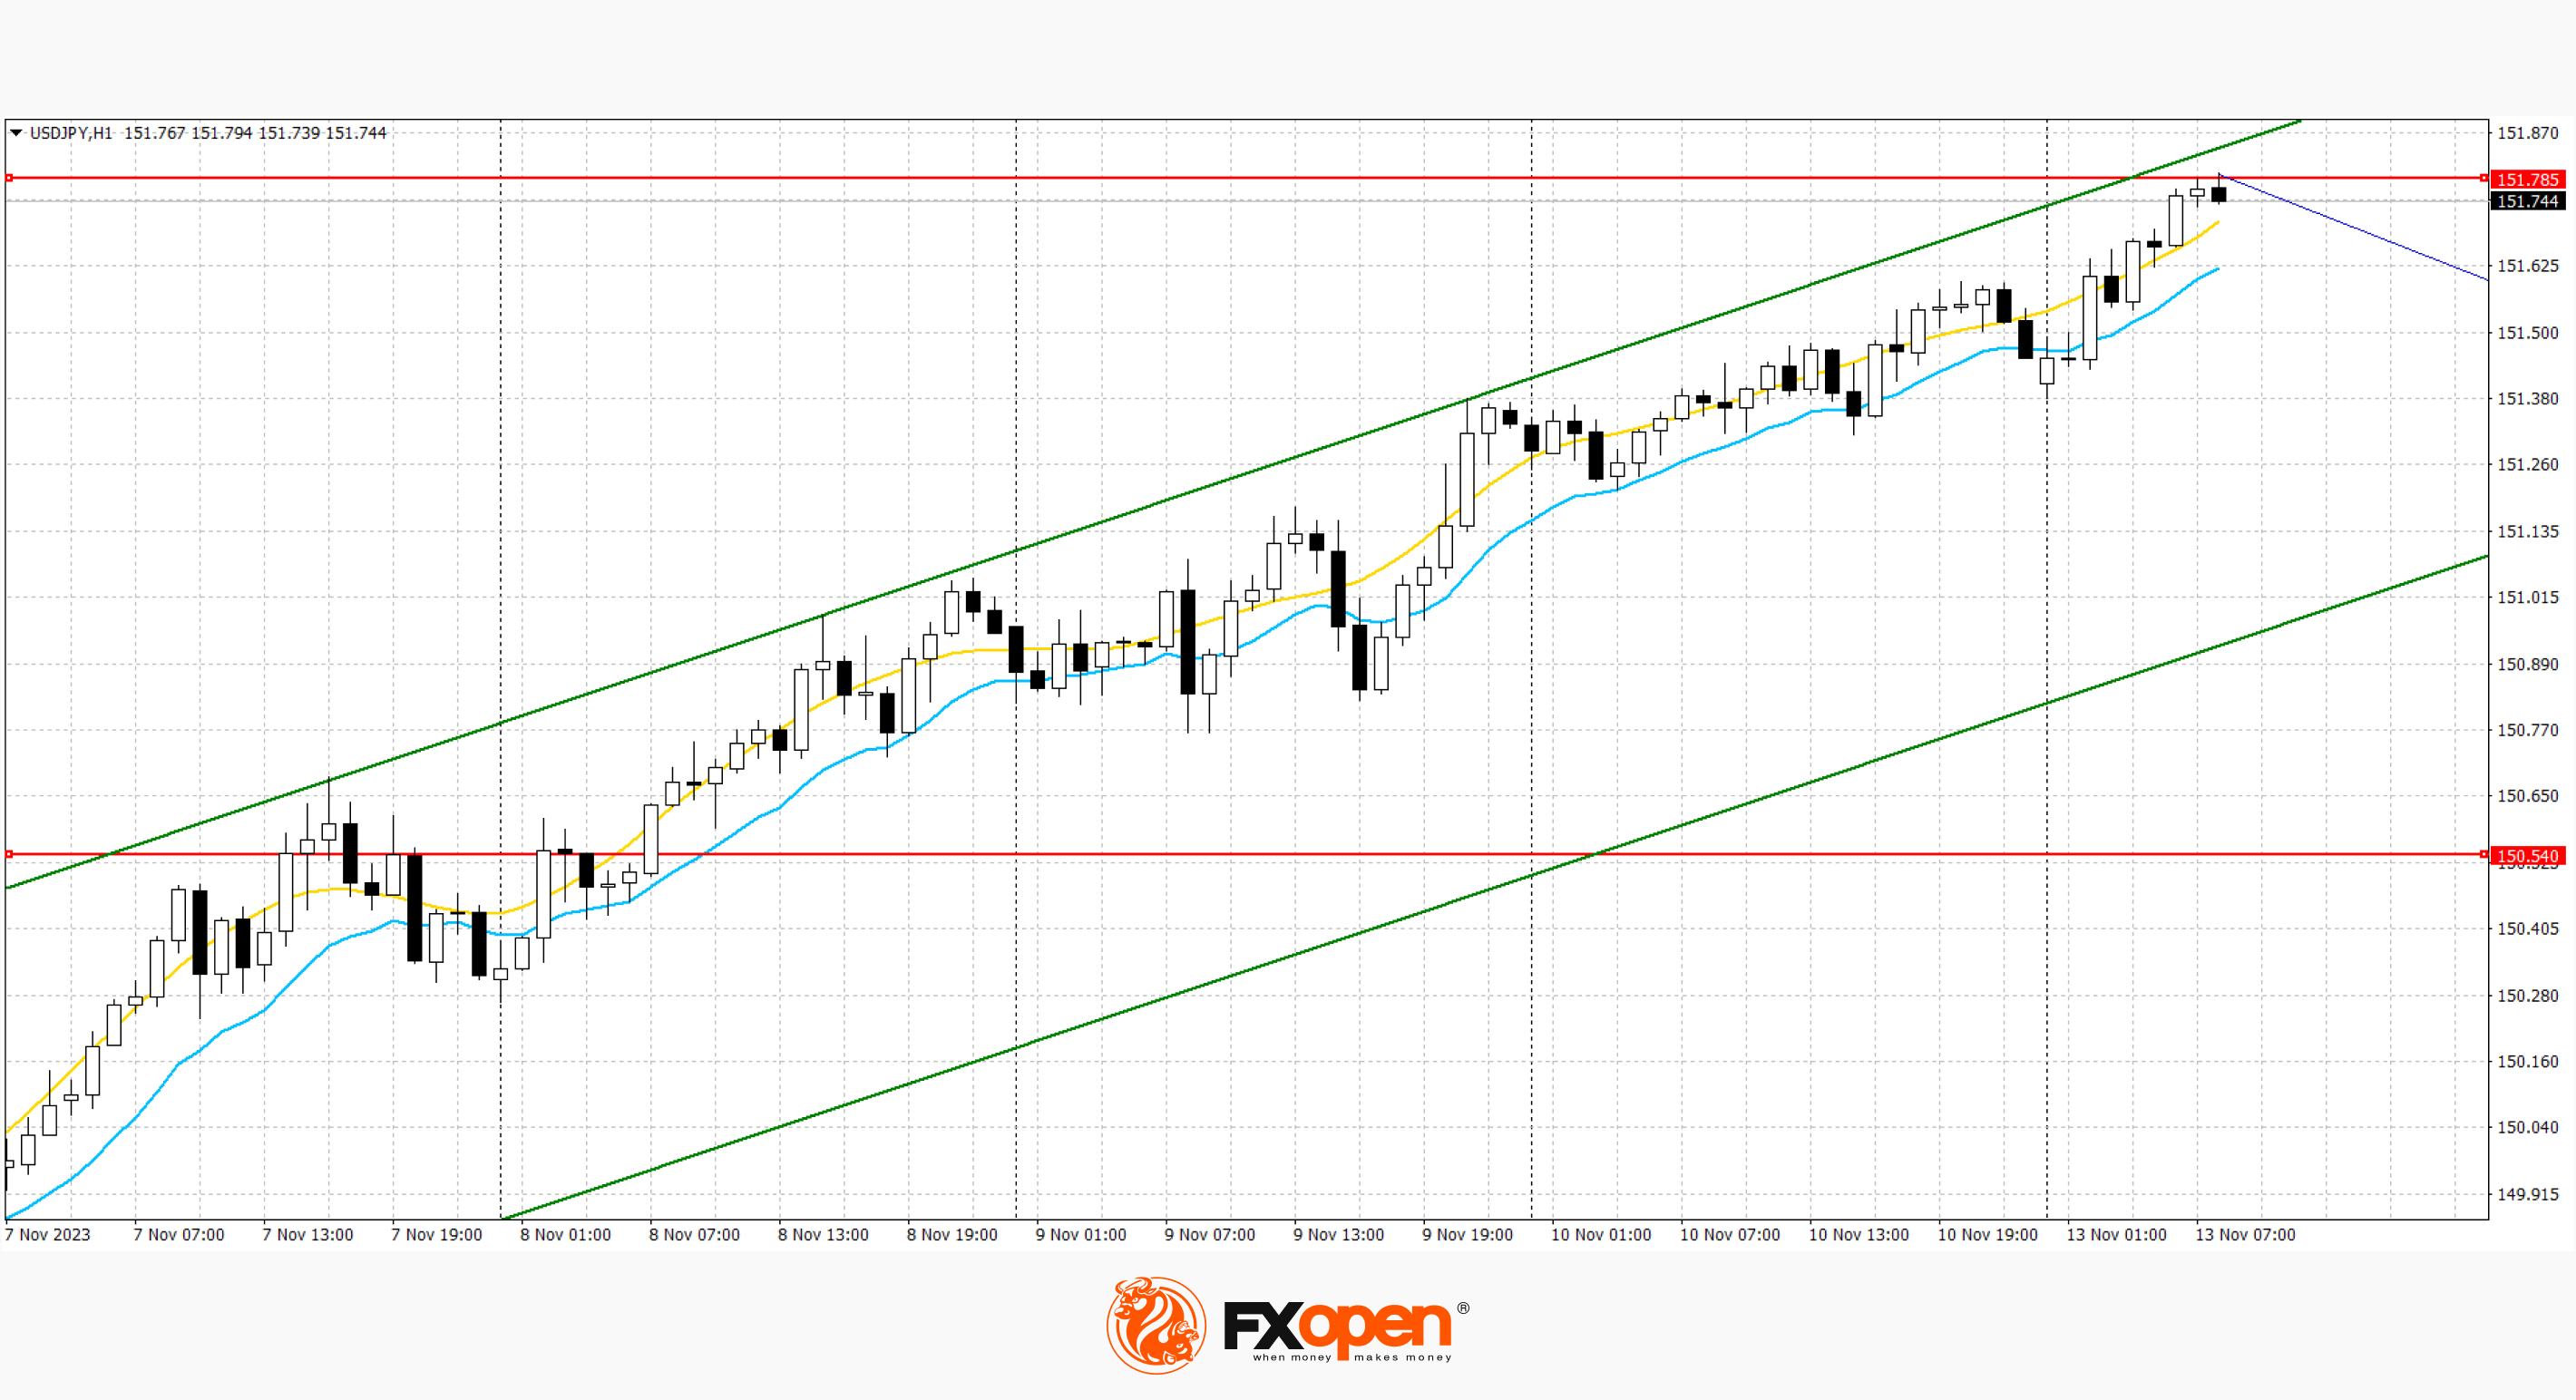
The previous ascending channel remains. Now the price has moved away from the upper border and may continue to move towards the lower border.
Trade over 50 forex markets 24 hours a day with FXOpen. Take advantage of low commissions, deep liquidity, and spreads from 0.0 pips (additional fees may apply). Open your FXOpen account now or learn more about trading forex with FXOpen.
This article represents the opinion of the Companies operating under the FXOpen brand only. It is not to be construed as an offer, solicitation, or recommendation with respect to products and services provided by the Companies operating under the FXOpen brand, nor is it to be considered financial advice.
Stay ahead of the market!
Subscribe now to our mailing list and receive the latest market news and insights delivered directly to your inbox.


Latest articles

Consolidation Ahead of NFP: Commodity Currencies Search for Direction
Commodity-linked currencies have entered a consolidation phase following recent directional moves, as market participants adopt a wait-and-see approach ahead of key US labour market data. Current price action reflects a balance between ongoing demand for the US dollar and attempts

The Real Driver Behind the Dollar Rally: Market Insights with Gary Thomson
The US dollar has been firm, but the drivers behind the move may be more complex than they first appear.
While geopolitical tension and shifts in risk sentiment play a role, current price behaviour seems increasingly influenced by inflation expectations

EUR/USD and USD/CHF Pull Back: Market Reacts to Fundamentals
European currencies have shown a recovery in recent trading sessions after their recent decline, displaying early signs of a reversal. The US dollar is weakening amid expectations surrounding upcoming US macroeconomic data, while market participants are reassessing their short-term positions