FXOpen

Towards the end of the week, the American currency managed to resume medium-term growth. Reversal combinations among commodity currencies were broken, and the pound, yen and euro went to test new lows. The sharp strengthening of the US dollar is most likely caused by the worsening geopolitical situation in the Middle East, rising oil prices and good fundamental data from overseas published this week. Thus, the business activity index (PMI) in the US services sector for October, published on Tuesday, showed growth: 50.9 versus 49.8. New home sales also increased in September: 759K versus 680K.
USD/JPY
The data published above contributed to the exit of the USD/JPY pair from the phase of long-term consolidation at 149.80-148.70. On the weekly USD/JPY chart, greenback buyers easily broke through the upper limit and are currently firmly entrenched above 150.00. If the corresponding foundation is released, the pair may rise to last year’s highs at 151.90. A corrective rollback is possible to 149.50-149.20.
Today at 15:30 GMT+3, we are waiting for the publication of data on basic orders for durable goods in the United States for September. Also at this time, the GDP figure for the third quarter will be released, and weekly data on the number of applications for unemployment benefits will be published.

USD/CAD
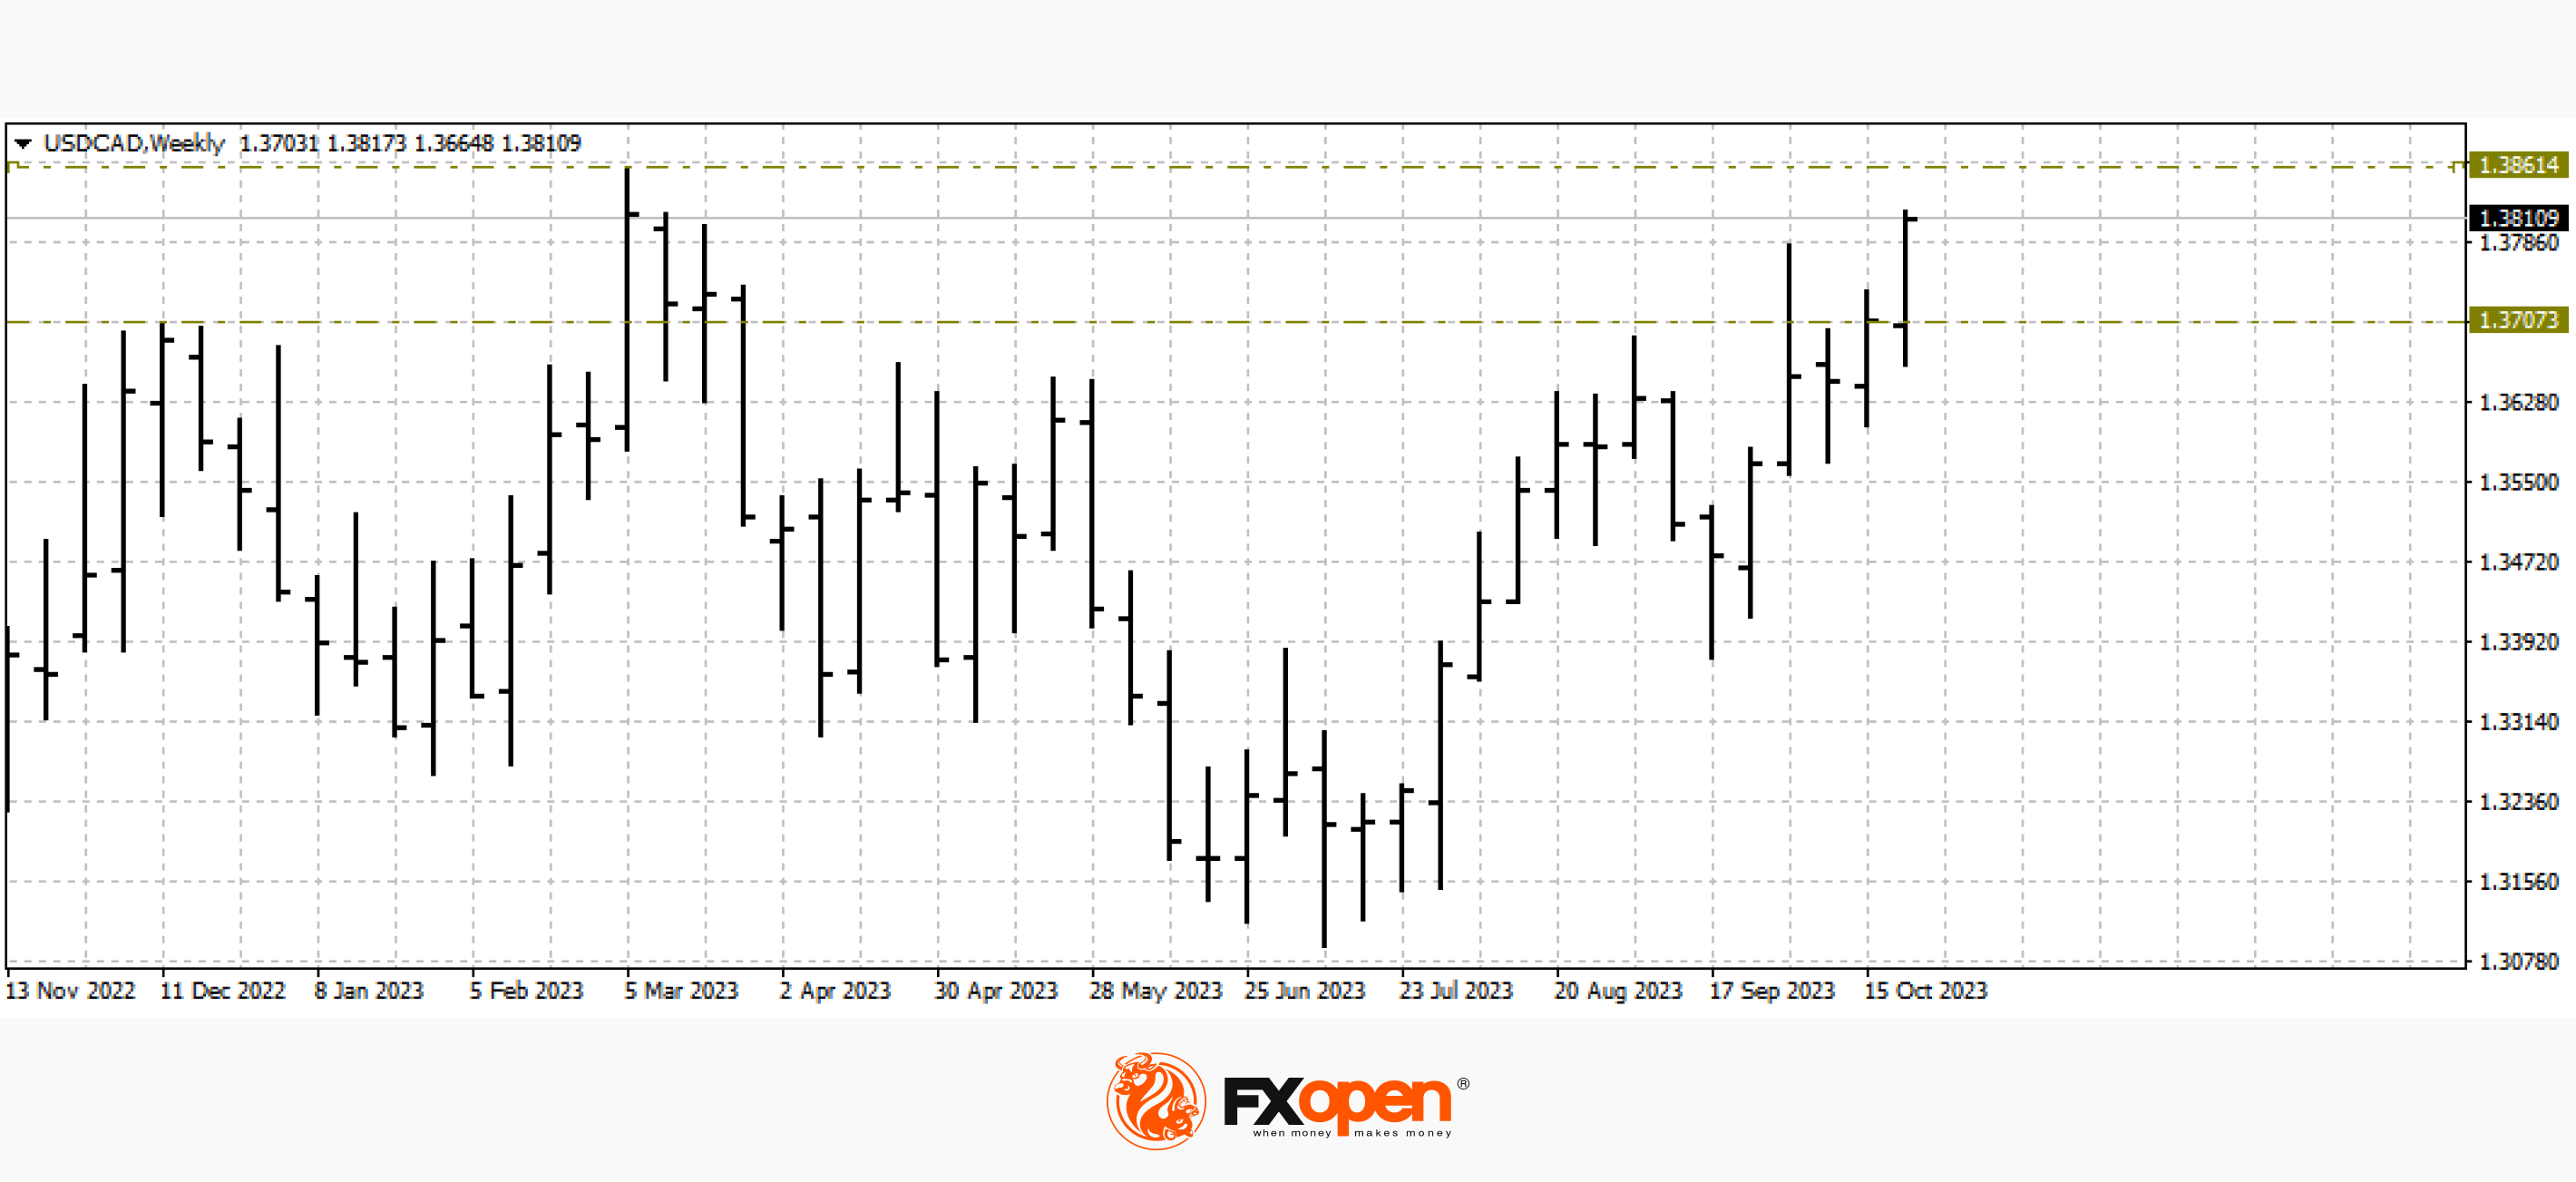
The Bank of Canada's decision to leave its benchmark interest rate unchanged has put downward pressure on the Canadian currency. On the weekly USD to CAD chart, the pair finally managed to gain a foothold above 1.3800, and is currently successfully continuing to grow. If the current situation does not change, a test of the current year’s highs at 1.3860 may occur. A downward rollback is possible to the recently broken resistance at 1.3750-1.3700.
At 15:30 GMT+3, pay attention to the publication of sales data in the Canadian manufacturing sector. Also at the same time, data on average income in Canada for the week will be released.

EUR/USD
Considering the EUR/USD technical analysis, buyers of the single European currency were unable to develop a full-fledged upward correction and stay above 1.0600. EUR/USD analysis today says the price may test recent lows at 1.0490-1.0440. Their breakdown and consolidation below may contribute to the start of a new downward wave in the direction of parity. Rejection of the downward scenario can only be considered after moving above 1.0700.
Today is a very important day for the further pricing of the pair. The ECB is scheduled a meeting today, at which it will announce the base interest rate and the regulator's further plans for monetary policy.

Trade over 50 forex markets 24 hours a day with FXOpen. Take advantage of low commissions, deep liquidity, and spreads from 0.0 pips. Open your FXOpen account now or learn more about trading forex with FXOpen.
This article represents the opinion of the Companies operating under the FXOpen brand only. It is not to be construed as an offer, solicitation, or recommendation with respect to products and services provided by the Companies operating under the FXOpen brand, nor is it to be considered financial advice.
Stay ahead of the market!
Subscribe now to our mailing list and receive the latest market news and insights delivered directly to your inbox.


