


USD/CAD, AUD/USD, EUR/USD Analysis: Commodity Currencies and Euro Poised to Resume Growth
FXOpen
After the publication of the FOMC protocols on Tuesday, the dollar managed to partially regain its lost positions. Thus, in the dollar/yen pair one could observe a corrective pullback to figure 149, the US dollar/canadian dollar pair almost tested 1.3800, and the AUD/USD pair tested the important level of 0.6500, but as support. European currencies also retreated from previously reached highs. However, US dollar buyers have not yet been able to develop a full-fledged upward movement, and yesterday evening the main trends established in early November continued in many pairs.
USD/CAD
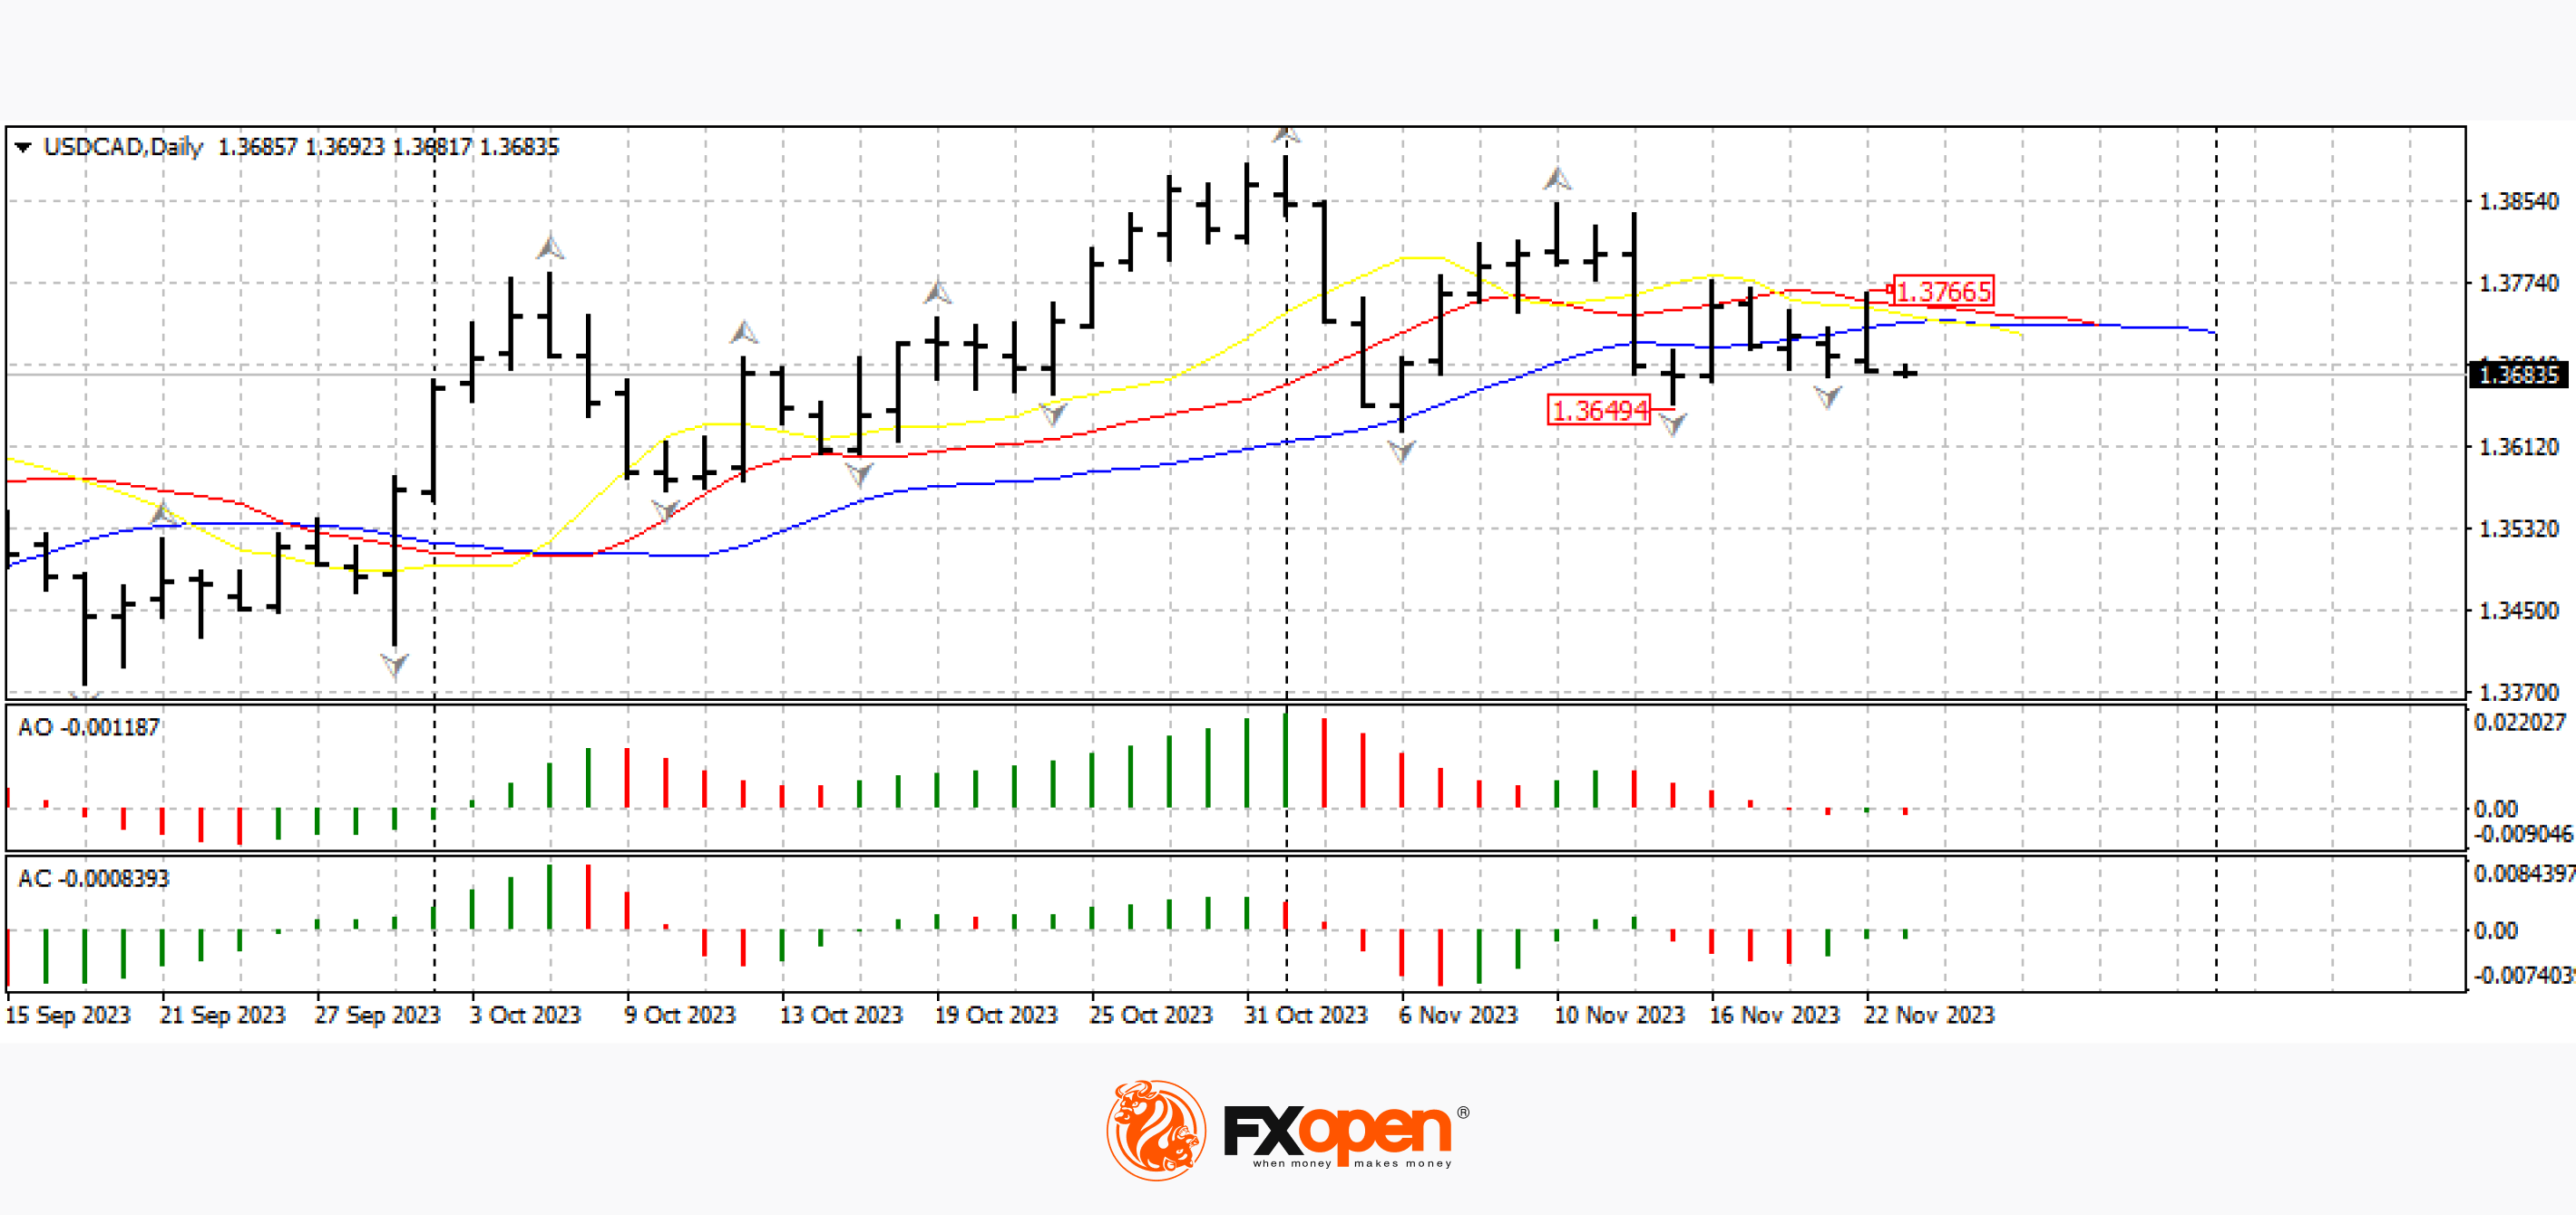
In the USD to CAD chart, we are seeing a rebound from the resistance located at the alligator lines on the daily timeframe. The pair continues to work out the reversal bearish combination from November 1st. With the appropriate foundation, a breakdown of the lower fractal at 1.3650 is possible and the pair may continue to decline in the direction of 1.3500-1.3400. We may consider canceling the downward scenario if the pair confidently consolidates above 1.3800.
Today at 16:30 GMT+3, we are waiting for data on wholesale sales and corporate income in Canada for the current quarter. The core Canadian retail sales index for September will be released at this time tomorrow.
AUD/USD
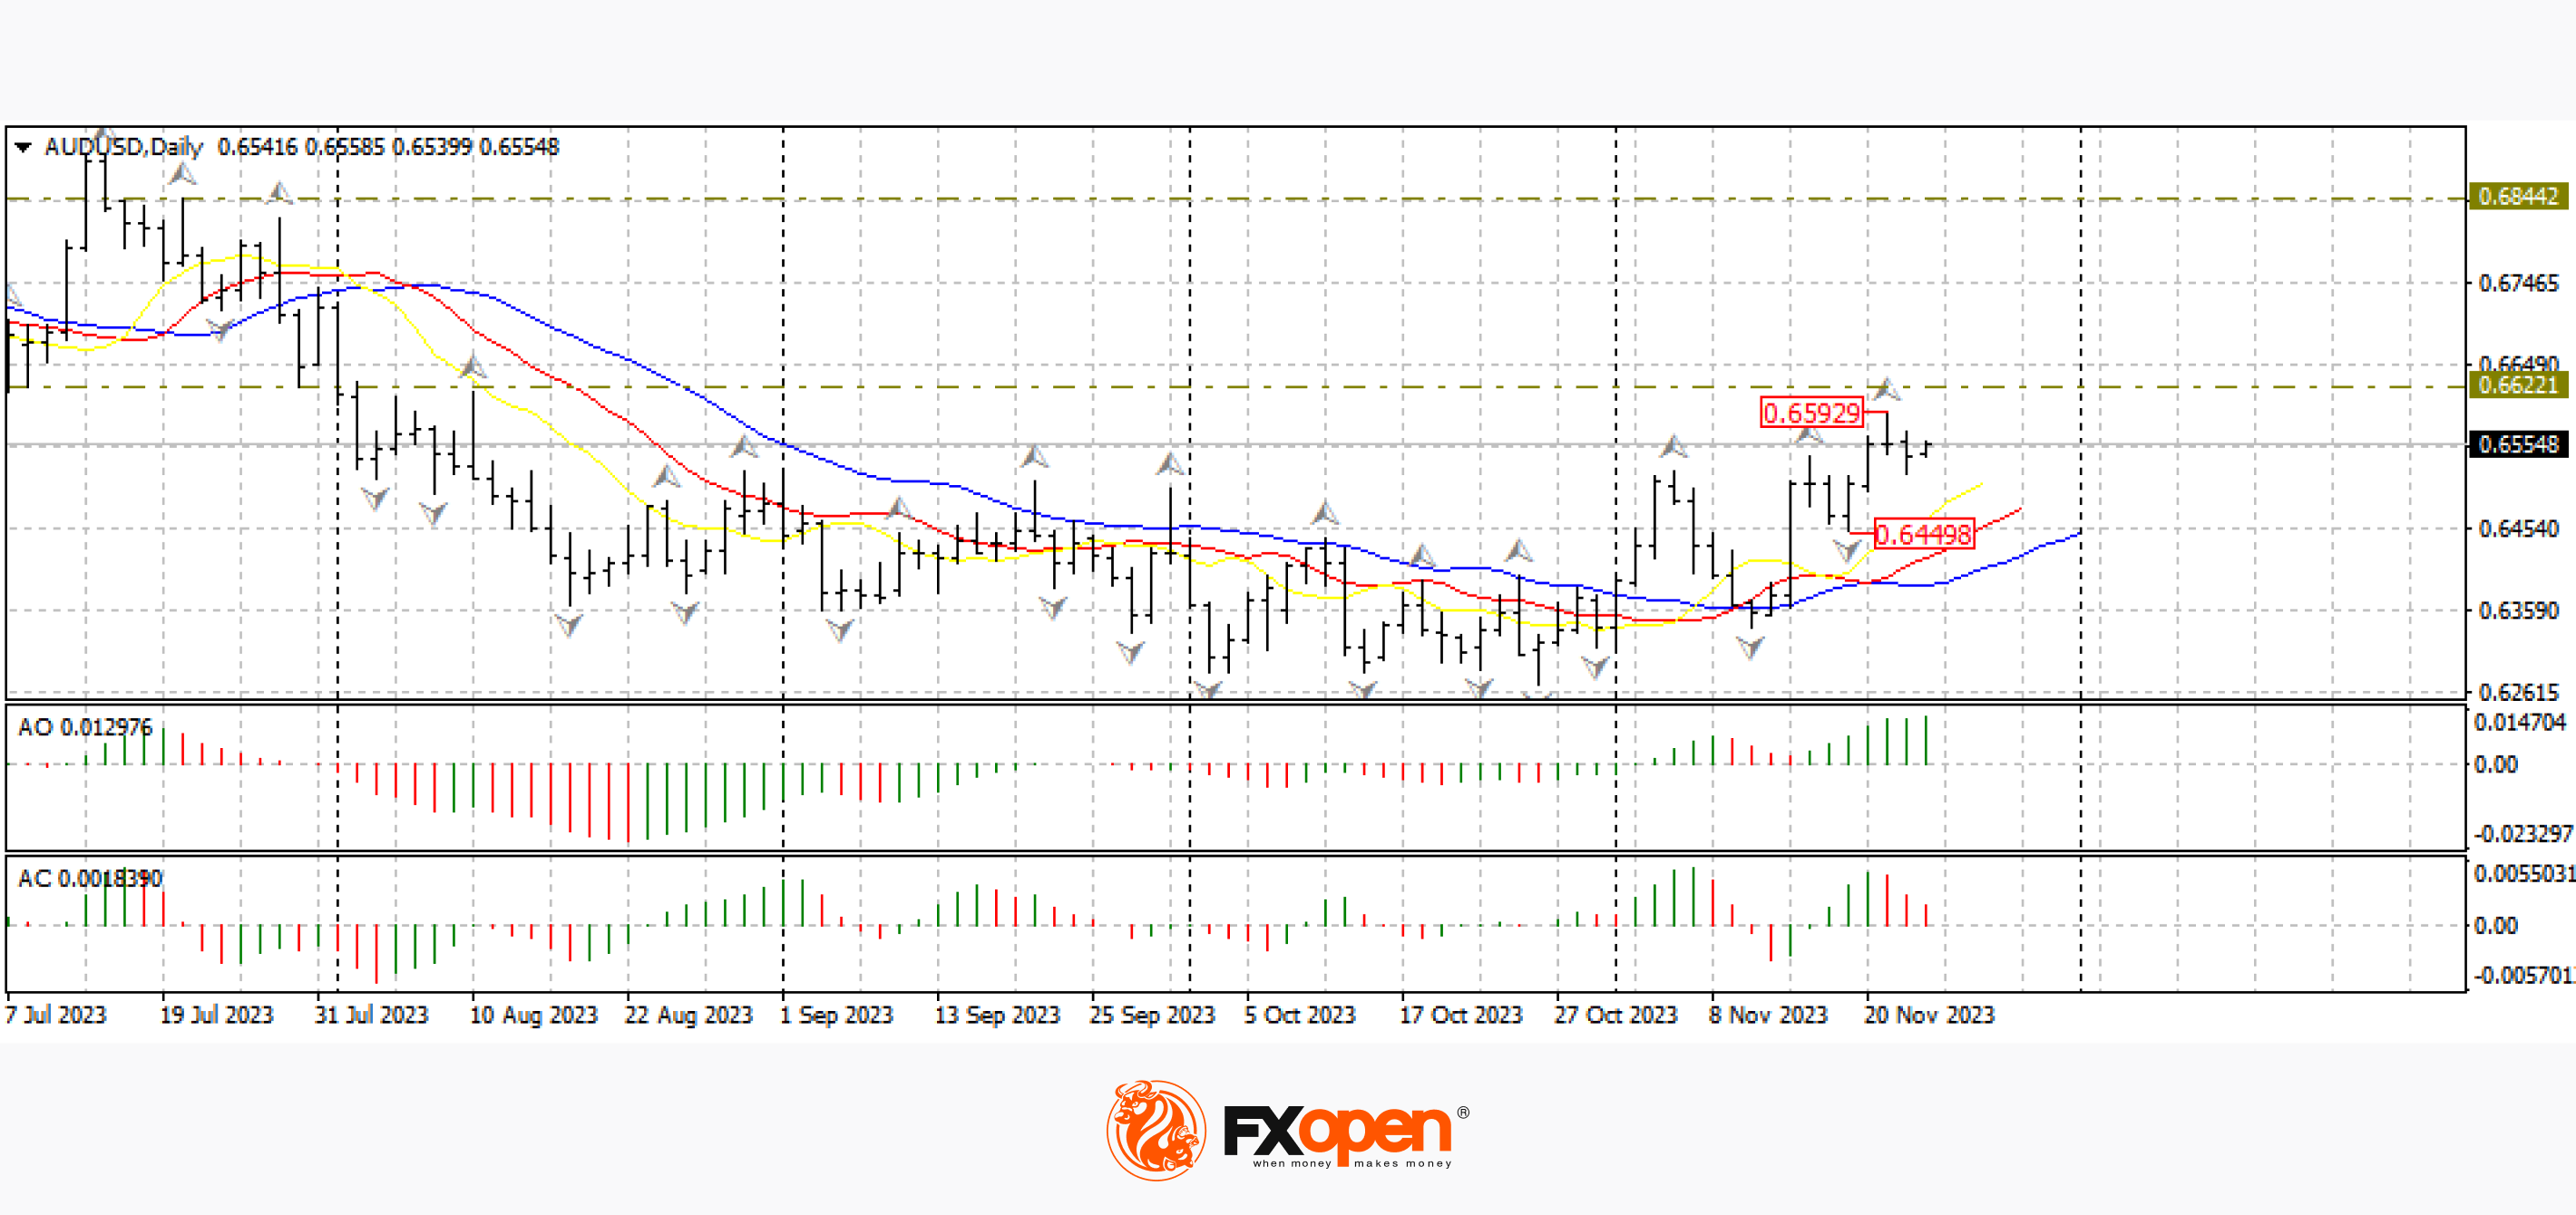
On the AUD/USD chart, the strengthening of the Australian currency has slowed down slightly this week. However, while the area 0.6500-0.6400 acts as support, we could expect a breakdown of the upper fractal at 0.6590 and continued growth in the direction of 0.6800-0.6700. A break in the upward scenario may only be considered after a confident consolidation below 0.6400.
Tomorrow at 17:45 GMT+3, pay attention to the publication of data on the US manufacturing business activity index (PMI) for November.
EUR/USD
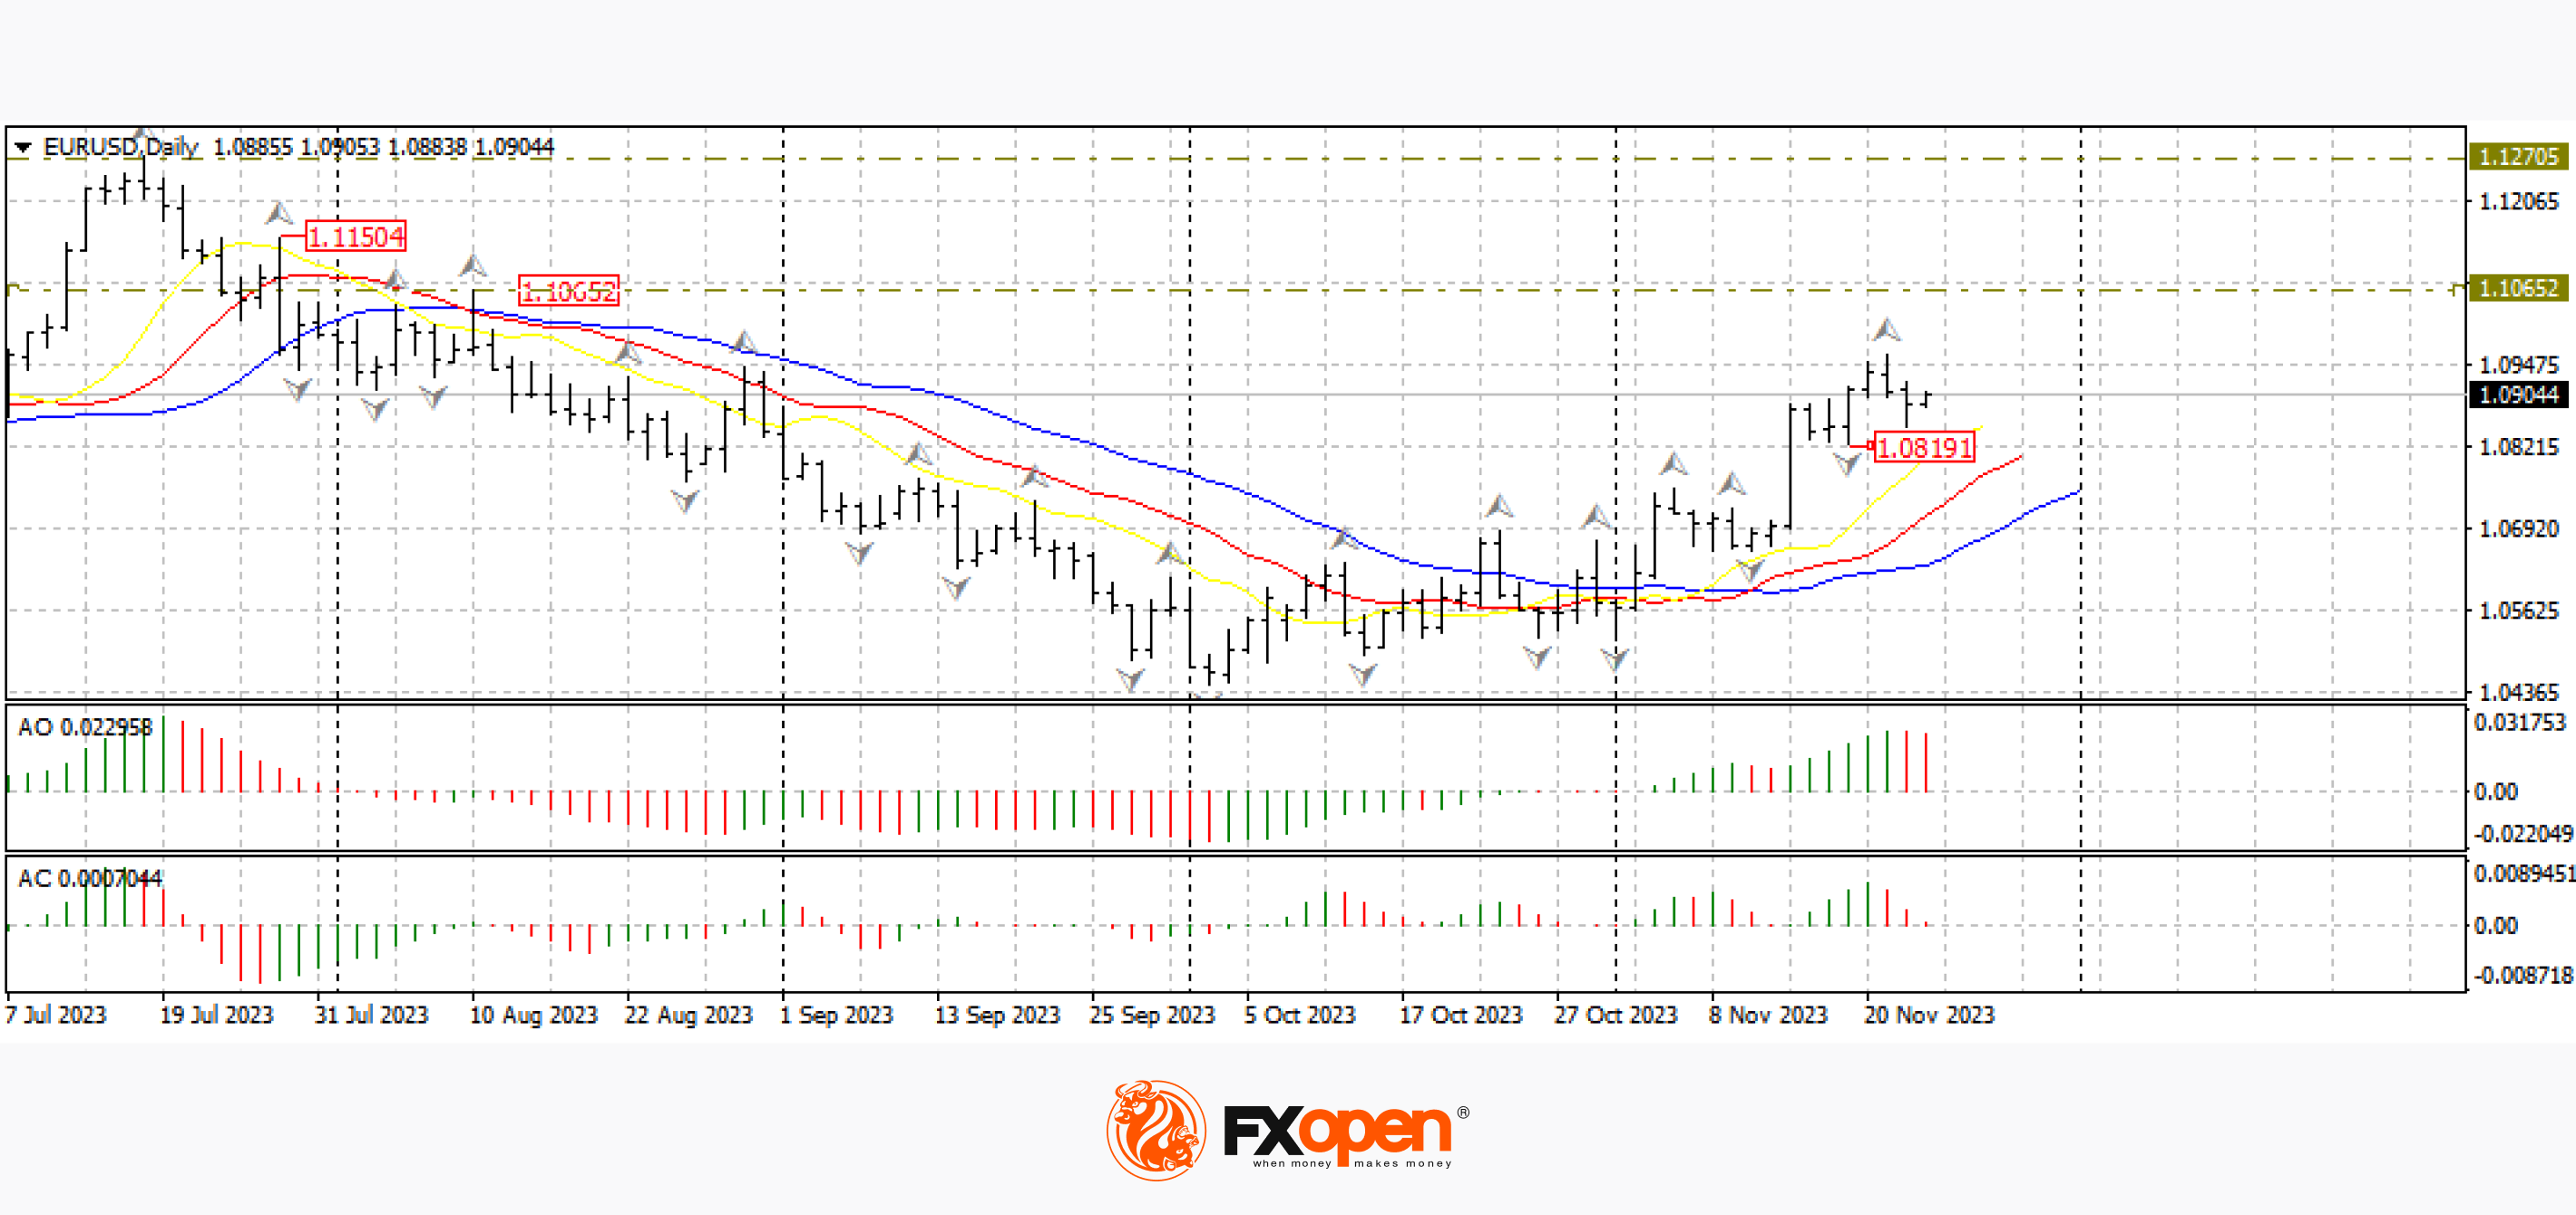
The single European currency fell after the publication of the FOMC protocols, failing to reach the psychological resistance of 1.1000. However, according to the EUR/USD technical analysis, buyers of the pair managed to keep the price above the significant range of 1.0850-1.0800, which increases the likelihood of an early resumption of growth.
The last trading sessions of the current five-day trading period are quite saturated with the fundamental data from the eurozone, which can both strengthen the current price direction and contribute to the formation of reversal combinations.
Today at 12:00 GMT+3, the eurozone manufacturing business activity index (PMI) for November will be published. The minutes of the last meeting of the ECB are scheduled to be published at 15:30 GMT+3. Also tomorrow at 12:00 GMT+3, ECB Chairman Christine Lagarde will speak.
Trade over 50 forex markets 24 hours a day with FXOpen. Take advantage of low commissions, deep liquidity, and spreads from 0.0 pips (additional fees may apply). Open your FXOpen account now or learn more about trading forex with FXOpen.
This article represents the opinion of the Companies operating under the FXOpen brand only. It is not to be construed as an offer, solicitation, or recommendation with respect to products and services provided by the Companies operating under the FXOpen brand, nor is it to be considered financial advice.
Stay ahead of the market!
Subscribe now to our mailing list and receive the latest market news and insights delivered directly to your inbox.


Latest articles

AI Valuations Are Back in the Spotlight
Artificial intelligence remains the dominant investment theme of 2026, but investors are increasingly questioning whether AI stock valuations are keeping pace with reality.
💰 Big Tech continues to invest at an unprecedented scale, with hyperscaler AI spending projected to exceed $800

AUD/CAD: Months of Indecision — Is a Breakout Finally Coming?
The Australian dollar has clawed back most of its end-of-June losses, when it touched three-month lows against the greenback amid escalating Middle East tensions. Since then, sentiment has improved: the RBA's Assistant Governor Sarah Hunter signalled the board stands ready

USD/JPY: Battling at the Top of the Triangle
On 3 July, Japan's Finance Minister, Satsuki Katayama, stated that the Ministry of Finance remains in close contact with US authorities regarding developments in USD/JPY as the yen traded near its weakest level in almost 40 years. Similar verbal