


Simple Trend Strategies
FXOpen

In trading, successfully navigating market trends can make all the difference. This article provides a deep dive into four simple yet effective strategies that show you how to trade with the trend. Regardless of your level of experience, these strategies offer actionable insights that can enhance your trading journey.
Understanding Trend Trading

Trend trading is a strategy that aims to capture gains by analysing an asset's movement in a particular direction. Traders use various methods like price action, moving averages and chart patterns to identify the trend, be it upward (bullish) or downward (bearish).
The core philosophy is "the trend is your friend," implying that it's generally more effective to move with the market trend rather than against it. Understanding the trend not only increases the chances of making successful trades but also minimises risk, as traders set up safeguards, like stop-loss orders, aligned with the trend's trajectory.
Trends are typically denoted by a series of higher highs (HH) and higher lows (HL) in an uptrend or lower highs (LH) and lower lows (LL) in a downtrend. Recognising these patterns is crucial for trading with the trend.
To follow along with these strategies, visit FXOpen’s free TickTrader platform. There, you’ll find each of the indicators and drawing tools necessary to put these strategies into action.
HMA Crossover Strategy

The Hull Moving Average (HMA) crossover strategy leverages two different HMA lengths to generate trading signals. The advantage of using HMA over other types of moving averages, like the Simple Moving Average (SMA) or the Exponential Moving Average (EMA), is its superior smoothing and reduced lag, providing more timely entries and exits.
The lengths of these HMAs should have a meaningful distance between them, such as 9 and 21 or 50 and 200, depending on the trader's preference and trading style. It’s also best to enter these trades in the direction of the broader trend direction.
Entry:
- For a bullish entry, traders may consider buying when the short-term HMA crosses above the long-term HMA.
- For a bearish entry, a selling position can be initiated when the short-term HMA crosses below the long-term HMA.
Stop Loss:
- Stop-loss orders may be placed either above or below a nearby swing point.
- Alternatively, the stop loss can be positioned just beyond the long-term HMA to provide a safety net.
Take Profit:
- Profits may be taken at support or resistance levels, identified beforehand.
- Another option is to exit the trade when an opposite HMA crossover occurs, signalling a potential trend reversal.
50% Retracement Strategy

The 50% Retracement Strategy is ideal for trend forex trading. It focuses on identifying an existing trend and then entering a trade at a 50% retracement level.
Essentially, once a trend has been confirmed through a series of higher highs and higher lows (for an uptrend) or lower highs and lower lows (for a downtrend), traders measure the distance between a last significant high and low within that trend. They then mark the midpoint as the 50% retracement level and aim to enter the trade at this point.
Entry:
- In an uptrend, traders may consider buying when the price retraces to the 50% level of the previous high-low range.
- In a downtrend, selling could be considered when the price retraces 50% from the previous low-high range.
Stop Loss:
- In an uptrend, a stop-loss order could be set below the last low to minimise risk.
- Conversely, in a downtrend, the stop-loss could be set above the last high.
Take Profit:
- Profits may be taken at the previous high in an uptrend or at the previous low in a downtrend.
- Alternatively, a suitable support or resistance level may serve as the exit point.
Breakout and Retest Strategy
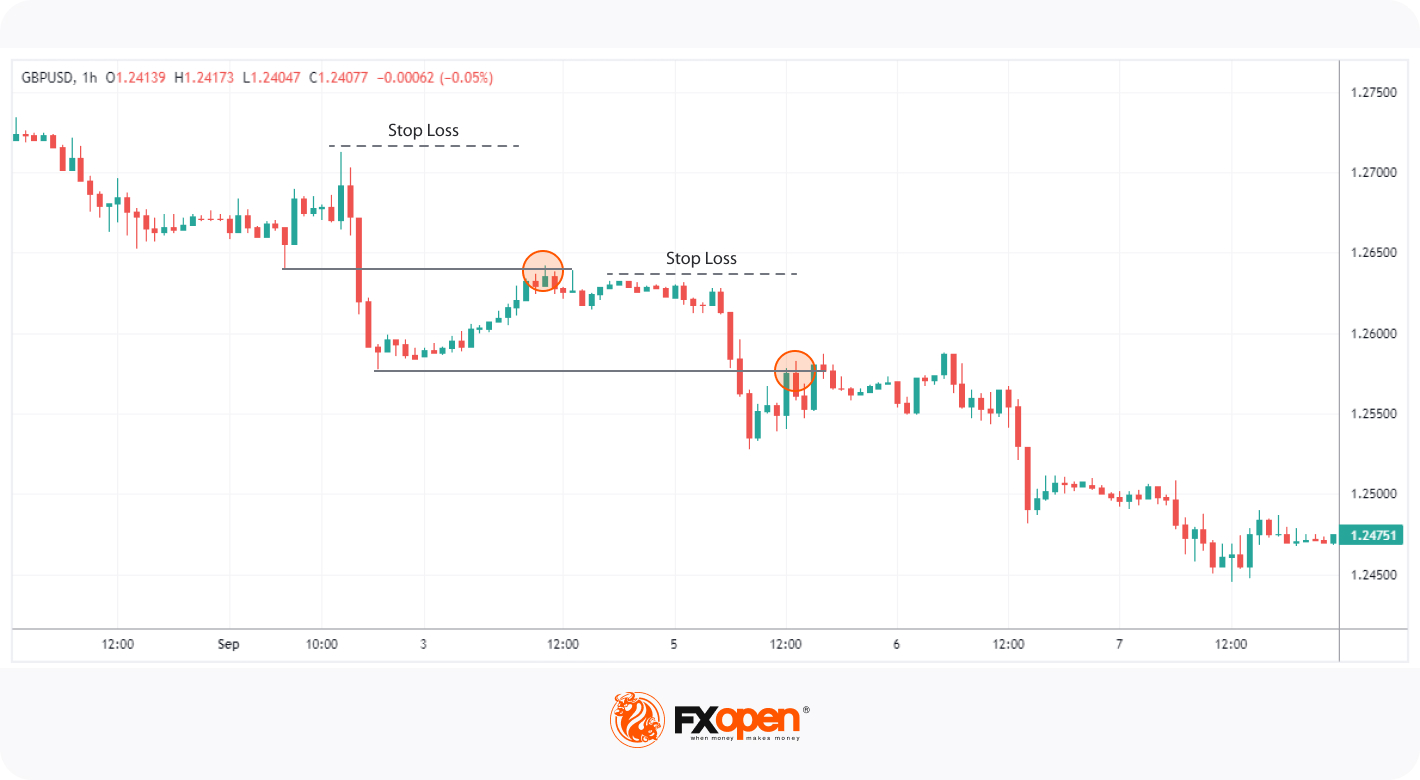
The Breakout and Retest Strategy operates on a principle similar to the 50% Retracement Strategy: it starts by identifying an existing trend. Instead of focusing on the 50% retracement level, this strategy pays attention to price levels that have just been broken – either a recent high in an uptrend or a recent low in a downtrend.
The idea is to capitalise on the market's tendency to retest those levels before continuing the trend. Unlike the 50% strategy, prices may not retrace as deeply and could simply touch the level just broken, providing a more immediate entry opportunity.
Entry:
- In an uptrend, traders may consider buying when the price retests a recently broken high.
- In a downtrend, a selling position could be initiated when the price retests a recently broken low.
Stop Loss:
- Stop-loss orders can be set below the swing low in an uptrend or above the swing high in a downtrend.
- Stop losses can also be placed above or below a relevant support or resistance level within the identified range.
Take Profit:
- Profits may be taken at the previous high in an uptrend or at the previous low in a downtrend.
- Alternatively, suitable support or resistance levels can serve as an exit point.
MFI Overbought/Oversold Strategy

The Money Flow Index (MFI) is an oscillator that measures the inflow and outflow of money into an asset over a specific period. It provides traders with additional insights into market conditions, particularly in identifying overbought (above 80) or oversold (below 20) situations. When an asset is in a trend but experiences a short-term pullback, the MFI can help indicate whether the pullback is likely to continue or reverse, assisting traders in trend day trading.
Entry:
- Traders may consider entering a long position when the MFI moves out of the oversold territory during an uptrend pullback.
- Conversely, in a downtrend pullback, a short position can be considered when the MFI exits the overbought zone.
Stop Loss:
- Stop-loss orders might be set just below/above the nearest swing low or high.
Take Profit:
- Profits may be taken at the high or low of the established trading range, depending on the trend direction.
- Alternatively, a suitable support or resistance level can serve as the exit point.
The Bottom Line
As traders, understanding and exploiting market trends is crucial for better trading outcomes. The strategies outlined in this article provide straightforward methods for trend-based trading, each ready for experimentation to suit your own trading style.
Once you have got to grips with how they work in our free TickTrader platform, you can consider opening an FXOpen account. When you do, you’ll gain access to hundreds of trending markets, ready to put your newfound skills to the test. Happy trading!
This article represents the opinion of the Companies operating under the FXOpen brand only. It is not to be construed as an offer, solicitation, or recommendation with respect to products and services provided by the Companies operating under the FXOpen brand, nor is it to be considered financial advice.
Stay ahead of the market!
Subscribe now to our mailing list and receive the latest market news and insights delivered directly to your inbox.


Latest articles

Pound Weakens After Soft UK Inflation Data as Euro Awaits Fresh Market Signals
The pound remains under pressure following the release of weaker-than-expected UK inflation data. The slowdown in inflation has strengthened expectations that the Bank of England could adopt a more accommodative policy stance in the coming months, weighing on sterling. Meanwhile,

Alphabet: Record Profit as Markets Await Their Verdict
On 22 July, Alphabet reported its Q2 2026 results, with revenue rising 24% year-on-year to $119.8 billion. Google Cloud revenue surged 82% to $24.77 billion, comfortably exceeding analysts' expectations. Search advertising generated $63.3 billion in revenue (+17%

NZD/USD Analysis: A Tug-of-War at the Critical Level
The kiwi has strengthened meaningfully against most peers this month. However, against the US dollar specifically, NZD/USD remains well below its 2026 highs, trading in the mid-0.58 area versus January's peak near 0.6075.
New Zealand's Q2 inflation