


What Is the Hull Moving Average?
FXOpen

While there are many types of moving averages used in trading, the hull moving average (HMA) stands out. Designed to minimise lags, it’s a firm favourite with some traders. This article takes a closer look at the HMA, detailing its calculation, uses, and advantages and disadvantages.
What Is the Hull Moving Average Indicator?
The hull moving average (HMA) indicator, developed by Alan Hull, is a type of moving average (MA) that aims to provide insights into market trends and reduce the lag associated with traditional moving averages. The lag refers to the delay between a change in price and the reflection of that change in the MA.
In trading, the HMA is often seen as an effective tool for catching market trends early, providing traders with an edge in timing their trades. It combines the smoothing benefits of a simple moving average (SMA) with a weighted moving average (WMA) to achieve a faster response to price changes.
Hull Moving Average Formula and Calculation
The HMA calculation involves several steps, each designed to incorporate speed and accuracy into the final result.
HMA= WMA(2*WMA(n/2) − WMA(n)),sqrt(n))
In this formula, ‘n' refers to the number of periods used in the calculation, 'WMA' refers to the weighted moving average, and 'sqrt' refers to the square root.
Firstly, the weighted moving average (1) is calculated over a certain period. Then, the WMA (2) is calculated again over a shorter period, usually half of the desired period. The shorter-period WMA is multiplied by two. The difference between these two WMAs is calculated – you will get a raw HMA. Finally, you will need to find the square root of the number of periods of the WMA and smooth the raw HMA with another WMA.
However, you don’t need to perform these calculations yourself – you can head over to FXOpen’s native TickTrader platform, where you’ll find the HMA and dozens of other trading tools.
How Do These Calculations Reduce Lag?
The initial WMA calculations provide a smoothing effect similar to an SMA but with more emphasis on recent data points. This increased weighting towards recent data makes the HMA more responsive to current price changes.
Further, the step of the calculation, which involves taking another WMA of the square root of the period, acts as a form of "double smoothing." This results in an average that closely tracks price movements, providing a more timely reflection of market trends and reducing lag significantly.
Using the Hull Moving Average in Trading
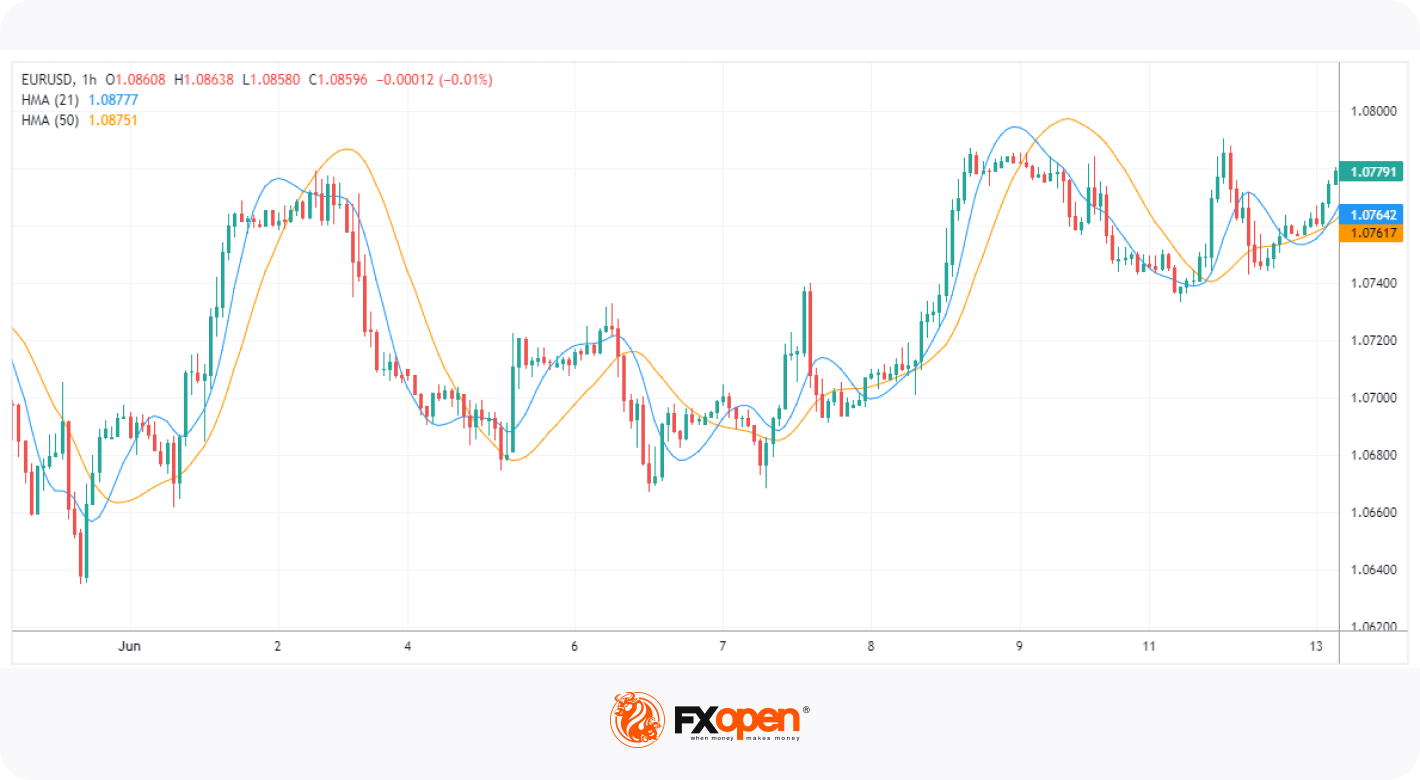
In trading, the HMA is a versatile tool. Traders commonly use it in a crossover strategy, where they monitor the interaction between the HMA line and the price line or another MA.
In a hull moving average crossover strategy, a buy signal is typically generated either when the price crosses above the HMA or when the HMA moves above another slower MA line, indicating an upward trend. Conversely, a sell signal is produced when the price crosses below the HMA or the HMA crosses beneath another MA, suggesting a potential downward trend.
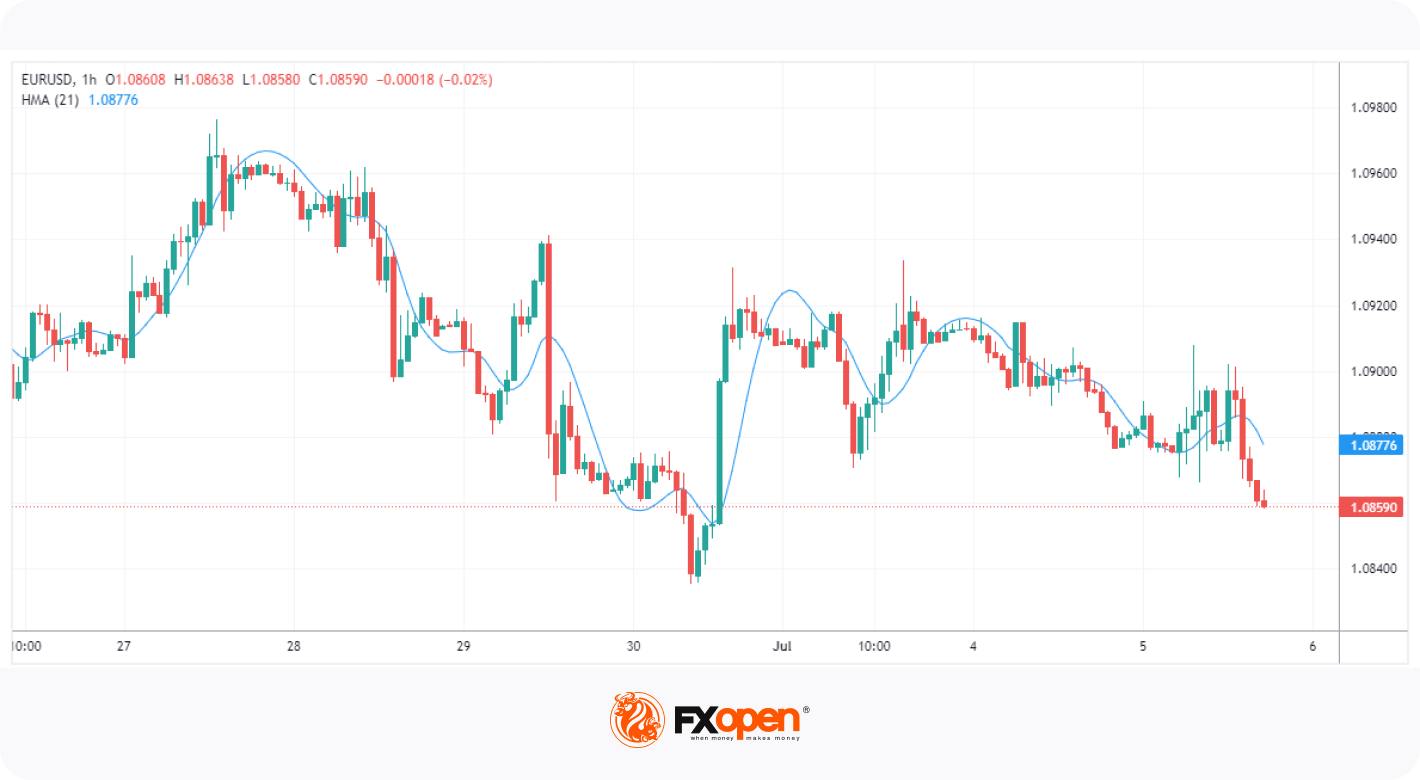
Traders can use MAs, including the hull MA, as dynamic support and resistance levels. In an uptrend, the HMA will serve as a support line, where the price is expected to rebound and continue rising. Conversely, in a downtrend, the HMA can be used to identify a resistance level at which the price will bounce down.
Additionally, the direction of the line itself can provide insight into the market's direction. An upward-sloping HMA implies an upward trend, while a downward-sloping line demonstrates a downward trend.
Advantages and Disadvantages of the Hull Moving Average
Despite its many benefits, the HMA comes with its own set of advantages and disadvantages that traders take into account.
The primary advantage of the indicator is its focus on reducing lag. By offering a faster and more responsive MA, it allows traders to identify and respond to market trends more quickly than traditional MAs. This rapid response time can provide an edge in volatile markets where speed and precision are essential.
However, its high sensitivity to price changes can also be a disadvantage. It may lead to a higher frequency of price crossovers, potentially creating more trading signals, which can be difficult to manage and may result in increased transaction costs. Furthermore, this sensitivity might generate false signals during periods of price consolidation, leading traders into unprofitable trades.
The Bottom Line
In summary, the hull moving average is a decent alternative to many of the more common moving averages. Its primary strength lies in reducing lag and providing a quicker response to market trends, but its high sensitivity can lead to a higher frequency of false alerts.
Ready to put your hull moving average strategy to the test? You can open an FXOpen account to access over 600+ markets and the advanced TickTrader platform. Happy trading!
This article represents the opinion of the Companies operating under the FXOpen brand only. It is not to be construed as an offer, solicitation, or recommendation with respect to products and services provided by the Companies operating under the FXOpen brand, nor is it to be considered financial advice.
Stay ahead of the market!
Subscribe now to our mailing list and receive the latest market news and insights delivered directly to your inbox.


Latest articles

Weekly Market Insights with Gary Thomson: The Week of Central Banks and Earnings
In this video, we’ll explore the key economic events and market trends, shaping the financial landscape. Get ready for insights into financial markets to help you navigate the week ahead. Let’s dive in!
In this episode of Market

Intel at a Crossroads: Earnings Beat Meets Technical Resistance
Intel has just delivered its strongest quarter in over fifteen years, and the market reaction says it all. Q2 2026 revenue surged 25% year-over-year to $16.1 billion, crushing the consensus estimate of $14.42 billion, while adjusted EPS of

Tesla: Complex Range Structure Breaks Down Following Quarterly Earnings
Tesla released its Q2 2026 results after the market closed on 22 July. Revenue increased 26% year-on-year to $28.24 billion, while vehicle deliveries reached a record 480,126 units. However, operating margin fell sharply to 1.4%, down from