


SMI Ergodic Indicator: Interpretation in Technical Analysis
FXOpen
The Stochastic Momentum Index (SMI) Ergodic indicator is a lesser-known tool. Still, it’s favoured by trend traders. In this article, we will uncover the mechanics of this indicator, its unique formula, and how traders can use it to trade trends and spot reversals.
What Is the SMI Ergodic Indicator?
The SMI Ergodic indicator, or Stochastic Momentum Index Ergodic, is a momentum oscillator that gauges the distance of a security's closing price relative to the range of its price movements. Unlike the traditional stochastic oscillator, which measures price velocity, the SMI provides a clearer, more precise picture of market trends by incorporating the concept of 'ergodicity'.
The ergodicity concept implies that the average of a time series over time and the average over the ensemble of all possible time series are identical. It provides a clear perspective of market behaviour by removing noise, thereby enhancing a trader's ability to identify market trends.
What Is the SMI Ergodic Indicator and Oscillator Formula?
The SMI Ergodic consists of three distinct components, each calculated using a different formula.
SMI Line
This key component is calculated as follows:
SMI = (PCDS / APCDS) * 100
Here, PCDS refers to Price Close Double Smoothed, and APCDS stands for Absolute Price Close Double Smoothed. Both these values are calculated based on Exponential Moving Average (EMA) periods.
Histogram Oscillator
Calculated as the difference between the True Strength Index (TSI) and the Exponential Moving Average (EMA) of the TSI:
Histogram = TSI - (EMA * TSI)
Signal Line
Simply the Exponential Moving Average (EMA) of the TSI:
Signal Line = EMA * TSI
The default setting for the SMI line is typically 20 periods, while the Signal and EMA are usually set to 5. The result is an indicator similar in appearance to the MACD.
Don’t worry about performing these calculations yourself. In FXOpen’s free TickTrader platform, you will find the SMI Ergodic indicator and dozens of other trading tools waiting for you.
How to Use the SMI Ergodic Indicator
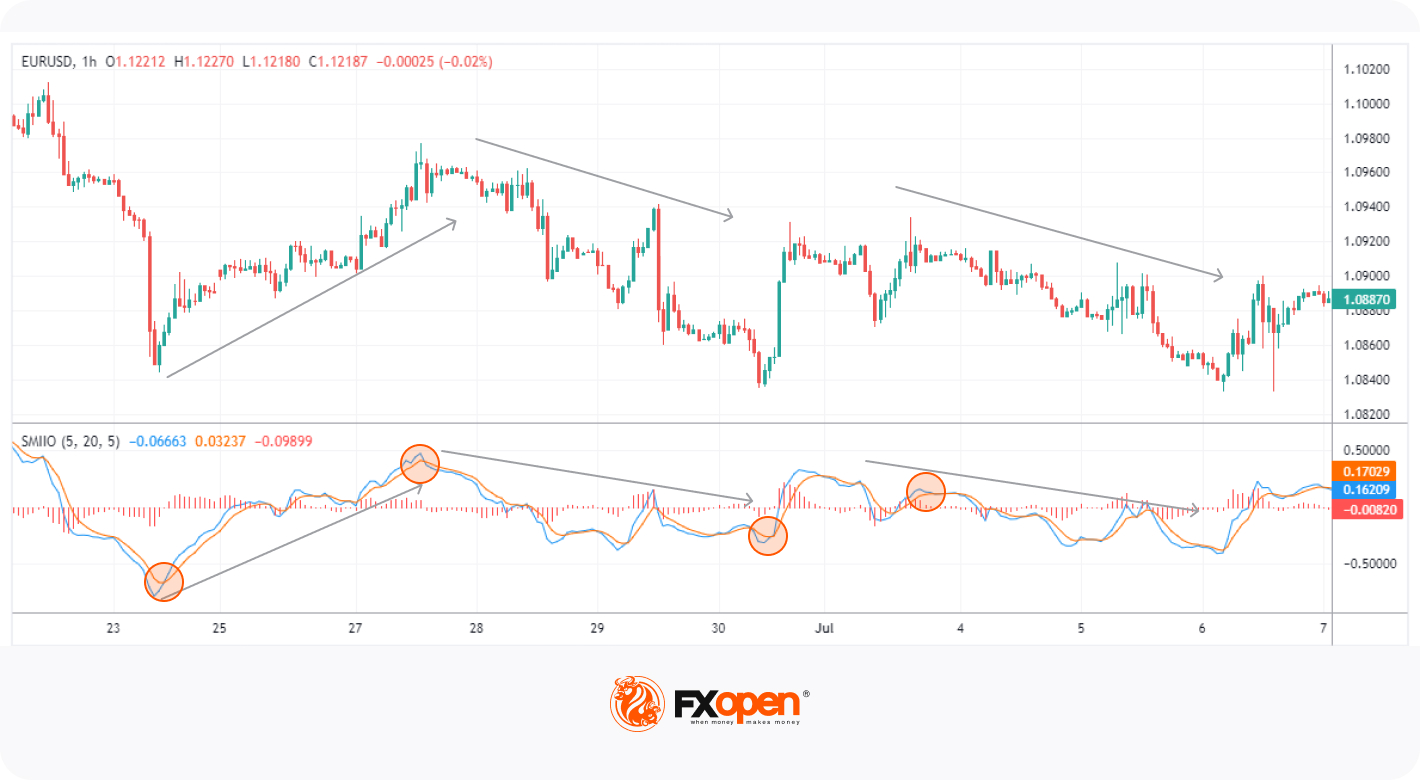
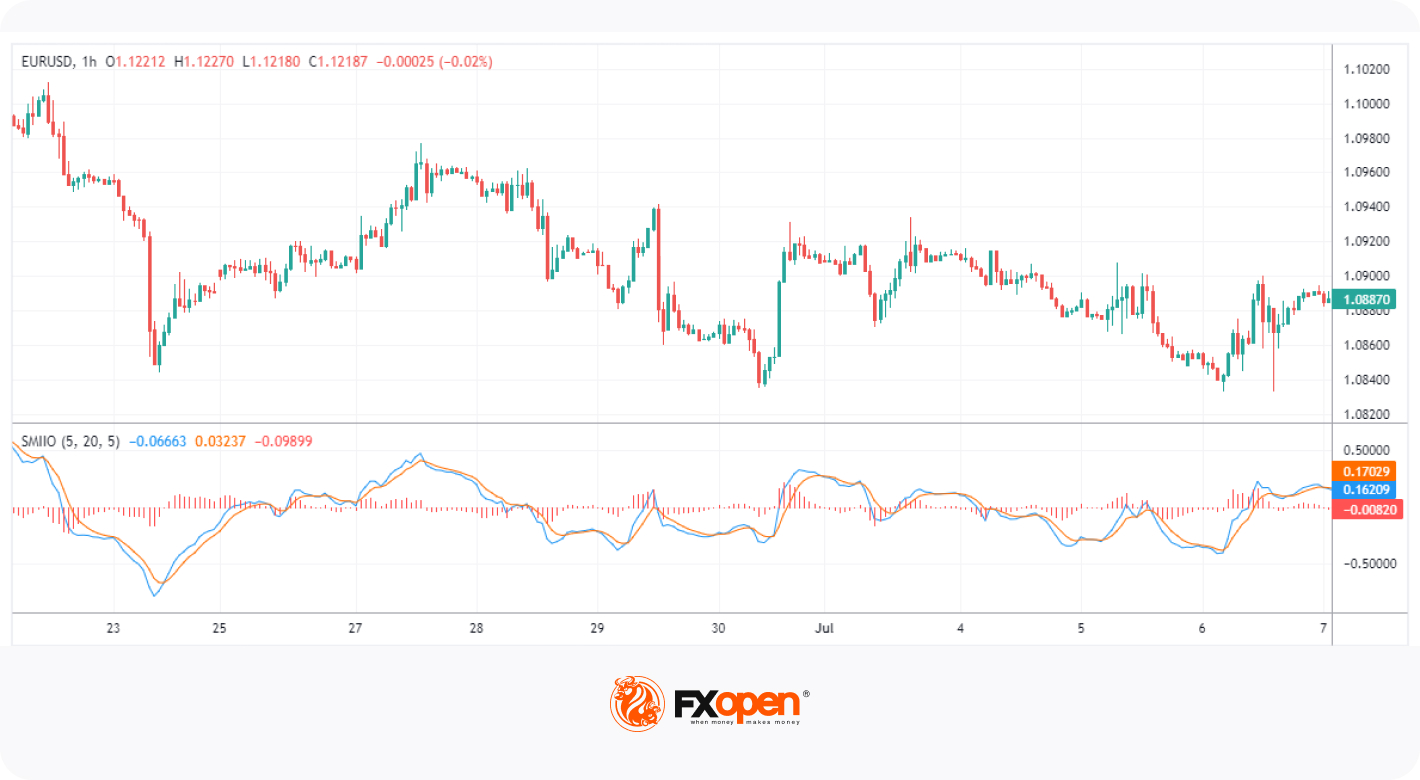
In stocks, commodities, crypto*, and forex, the SMI Ergodic oscillator offers traders several practical applications. It's particularly useful for identifying the underlying trend in a market. An upward-trending SMI line typically signals bullish market conditions, whereas a downward-trending line suggests bearish market conditions.
In addition to identifying market trends, the SMI Ergodic serves as a strong tool to spot potential entry and exit points. When the SMI line crosses above the signal line, it is generally considered a bullish signal, indicating a good entry point. On the contrary, when it crosses below the signal line, it is often seen as a bearish signal, suggesting a potential exit point or a short-selling opportunity.
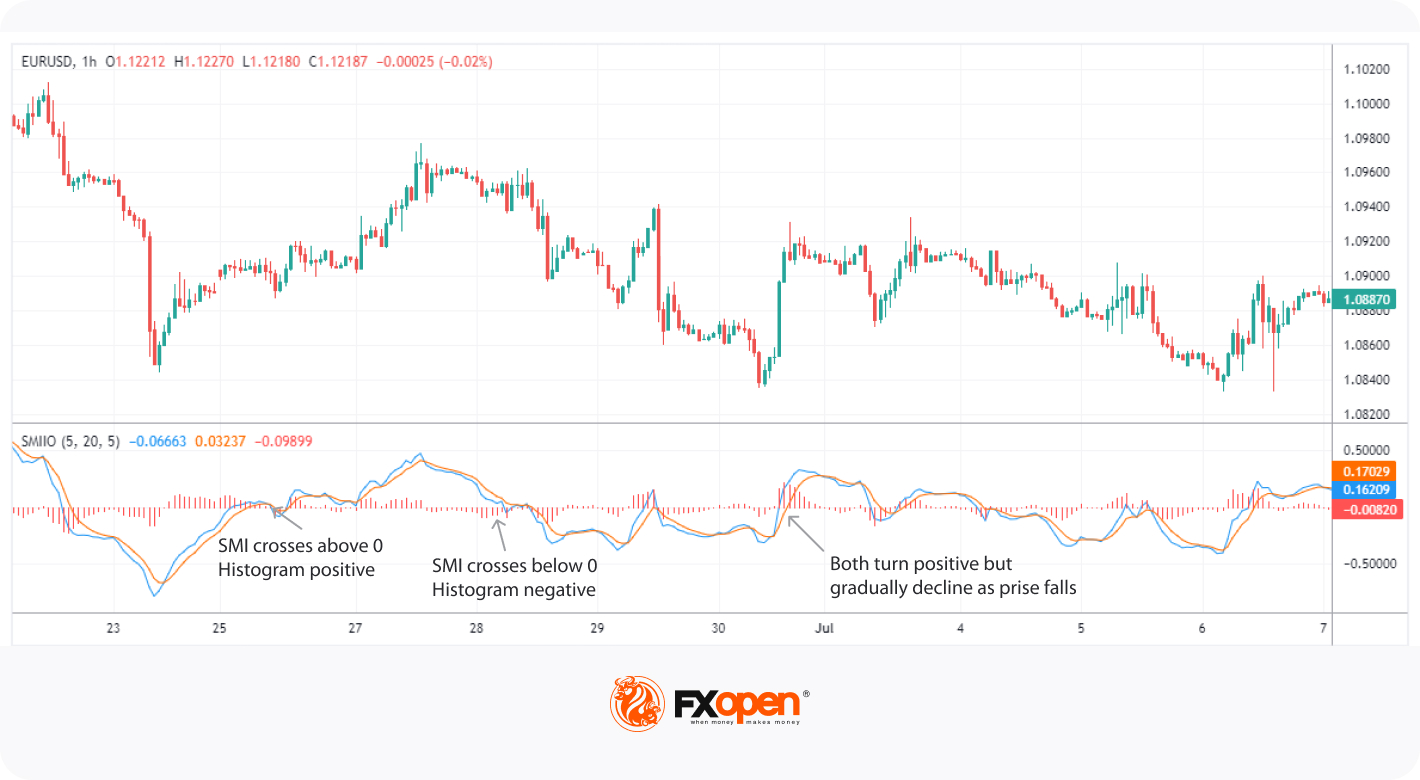
Beyond trend identification and spotting entry and exit points, the SMI Ergodic indicator also helps traders understand market momentum. If the SMI line is above 0, it points to positive momentum, signalling upward price movement. Conversely, if it falls below 0, it indicates negative momentum, suggesting downward price movement.
Lastly, the histogram oscillator can serve as a confirmation tool. If the histogram bars are above 0 and growing in size, this confirms a strong upward momentum. Conversely, if the histogram bars are below 0 and growing in size, this confirms a strong downward momentum.
The Bottom Line
In summary, the SMI Ergodic offers traders a multi-dimensional view of the market. By helping to identify market trends, entry and exit points, and market momentum, it has a solid position in any trader's arsenal. Still, it may provide incorrect signals or be misunderstood due to the subjectivity of its interpretation.
While it may be one of the more complex trading tools out there, don’t let that stop you. You can practise your SMI skills in our free TickTrader platform, and when you are ready, open an FXOpen account. Once you do, you’ll be able to put your SMI strategy to the test across 600+ markets and benefit from ultra-fast execution speeds and competitive trading costs. Happy trading!
*At FXOpen UK and FXOpen AU, Cryptocurrency CFDs are only available for trading by those clients categorised as Professional clients under FCA Rules and Professional clients under ASIC Rules, respectively. They are not available for trading by Retail clients.
This article represents the opinion of the Companies operating under the FXOpen brand only. It is not to be construed as an offer, solicitation, or recommendation with respect to products and services provided by the Companies operating under the FXOpen brand, nor is it to be considered financial advice.
Stay ahead of the market!
Subscribe now to our mailing list and receive the latest market news and insights delivered directly to your inbox.


Latest articles

Amazon: Record Earnings Are Priced In as the Trend Loses Momentum
Fundamental backdrop
In the first quarter of 2026, Amazon (AMZN on FXOpen) reported a 17% increase in net sales to $181.5 billion. AWS revenue grew by 28% — its fastest pace in 15 quarters — while operating margin reached a record

Brent: The Downtrend Begins to Crack
Fundamental backdrop
In April 2026, the closure of the Strait of Hormuz pushed Brent prices to their highest levels per barrel since 2022. However, diplomatic developments reversed the market’s direction: by the end of May, prices had fallen by

Euro and Sterling Weaken as the Dollar Strengthens Ahead of Key US Data
The US dollar continues to hold firm against its major counterparts, supported by strong US macroeconomic data and expectations surrounding the release of further labour market indicators. Additional support for the greenback comes from persistent inflationary risks and the Federal