


Smoothed Moving Average: Definition and Uses
FXOpen
Navigating the trading landscape requires precise tools. The Smoothed Moving Average is one such indicator, offering traders clarity on market trends and reversals. In this FXOpen article, we uncover its significance, calculation, and application.
What Is a Smoothed Moving Average?
The Smoothed Moving Average (SMMA) is a technical indicator used by traders to gauge price momentum and trends in a given asset. Unlike traditional moving averages, this indicator considers a more extended history of price data, which smoothes out short-term fluctuations. This provides a clearer, less erratic representation of market movements, making it especially useful for traders aiming to capture longer-term trends and reduce the influence of minor spikes or dips.
How Is the Smoothed Moving Average Calculated?
The Smoothed Moving Average (SMMA) formula differs from other similar averages. Here's a detailed explanation:
- Starting Point: Begin with a Simple Moving Average (SMA) for the initial period.
- Subsequent Periods: For the periods that follow, the Smoothed Moving Average (SMMA) mathematical sequence is determined by the formula:
SMMA = (SMMA# – SMMA* + CLOSE)/N
Where:
- SMMA# signifies the smoothed sum from the previous bar.
- SMMA* stands for the last smoothed moving average bar.
- CLOSE is the prevailing closing price when making the calculation.
- N represents the number of smoothing periods.
This calculation integrates the past SMMA value, making sure that earlier data retain an impact on the current value, producing the hallmark smoother trajectory of this tool.
SMMA vs Other Moving Averages
The SMMA considers a broad range of data, offering a balanced view of trends. In contrast, the SMA gives equal weight to each data point, providing less overall insight. The Exponential Moving Average (EMA) emphasises recent prices, reacting quicker than other MAs to changes. While each has its merits, this tool’s comprehensive approach produces a less volatile, more consistent picture of market movement. You can learn more about moving averages here.
SMMA Trading Strategies
The Smoothed Moving Average is renowned for its utility in various trading strategies due to its capacity to reduce noise from short-term fluctuations. Let’s take a look at three ways to use this indicator in a strategy.
Trend Following
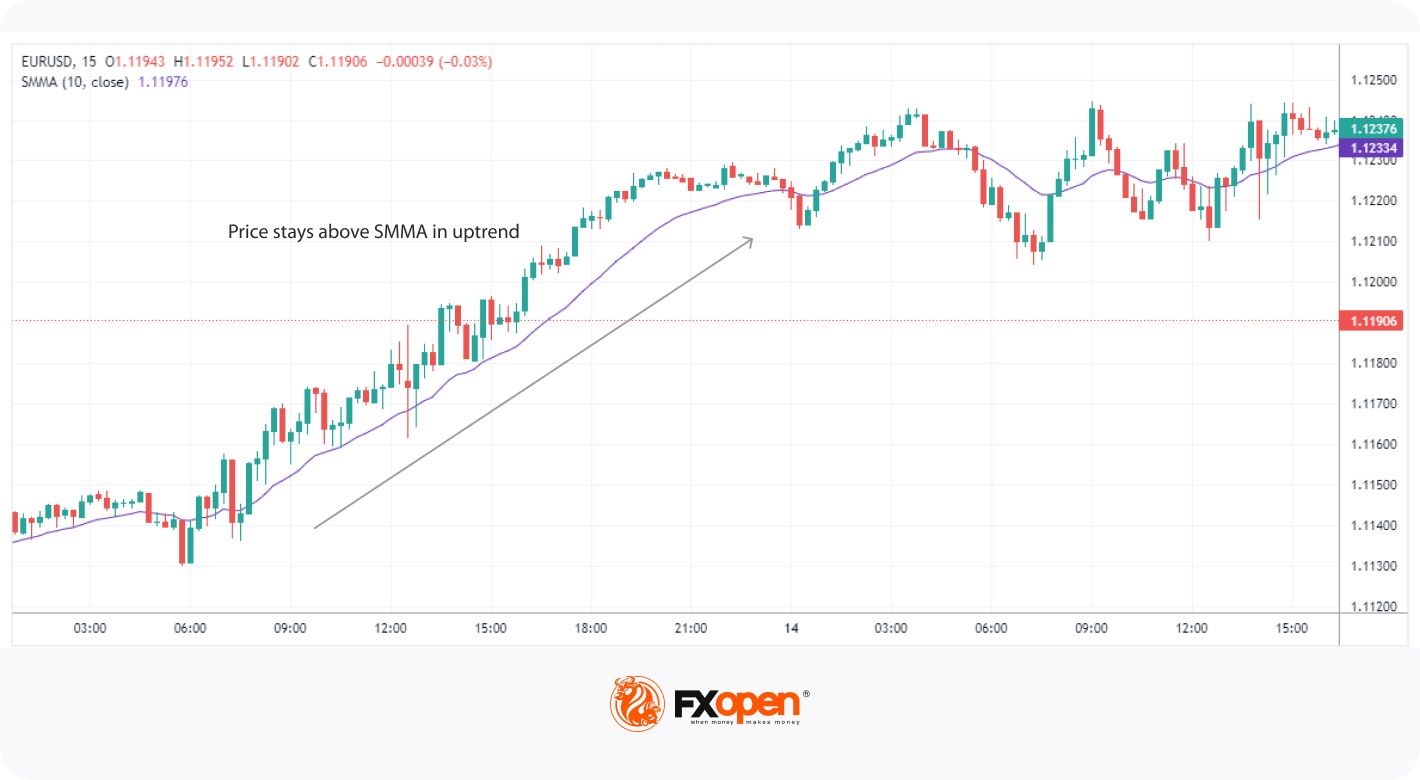
A fundamental principle in trading is "the trend is your friend." The SMMA, with its elongated data consideration, provides a clear view of prevailing market trends. Traders often look for instances where the price stays consistently above or below the line. When an asset remains above it, it's generally seen as a bullish trend, and when below, a bearish trend. Acting on these can aid in ensuring traders ride the trend.
Reversals
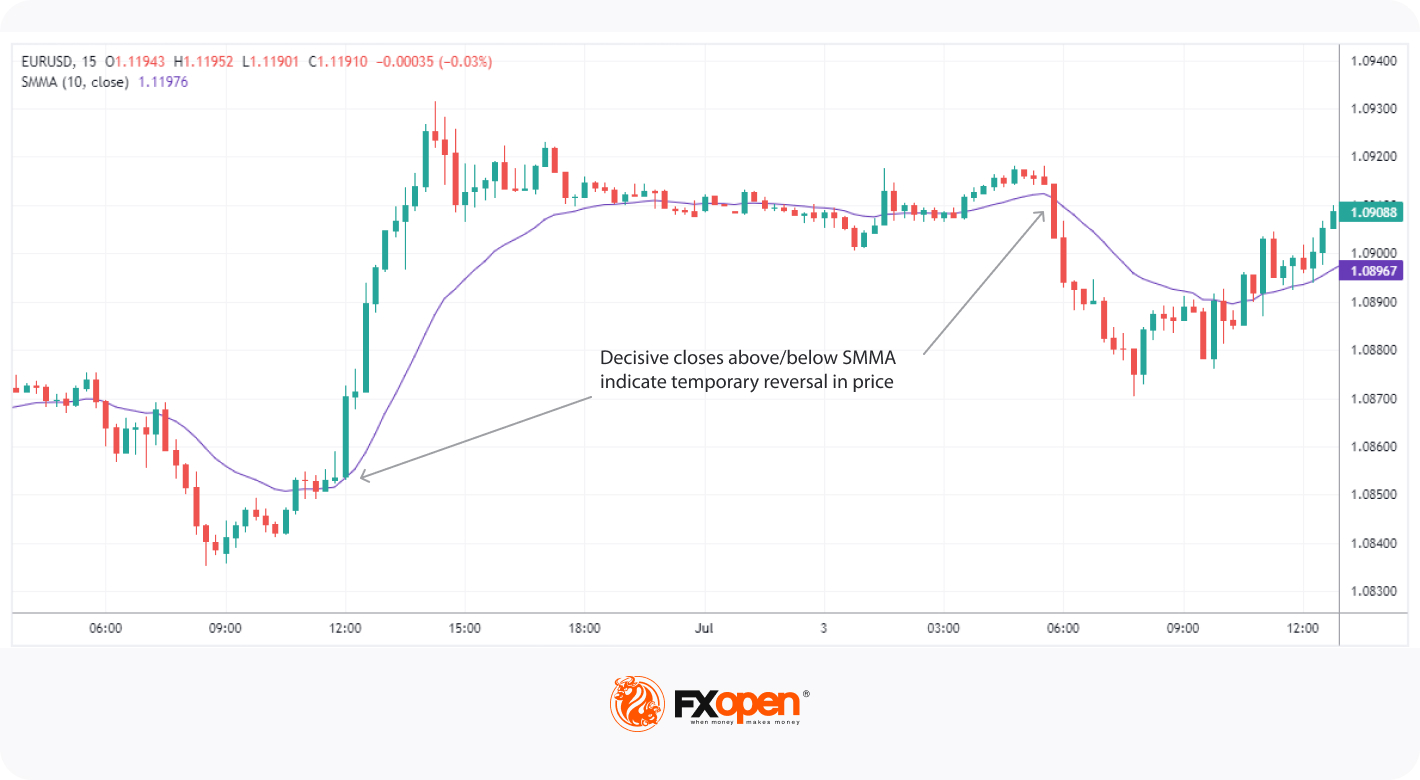
An essential strategy with this indicator revolves around spotting potential market reversals. This is achieved by observing crossovers. When the price crosses above the indicator, it can signify a potential upward reversal or a bullish turn. Conversely, when it crosses below, a bearish sentiment might be looming. A Smoothed Moving Average crossover can alert traders to buy or sell opportunities.
Current Price Concept
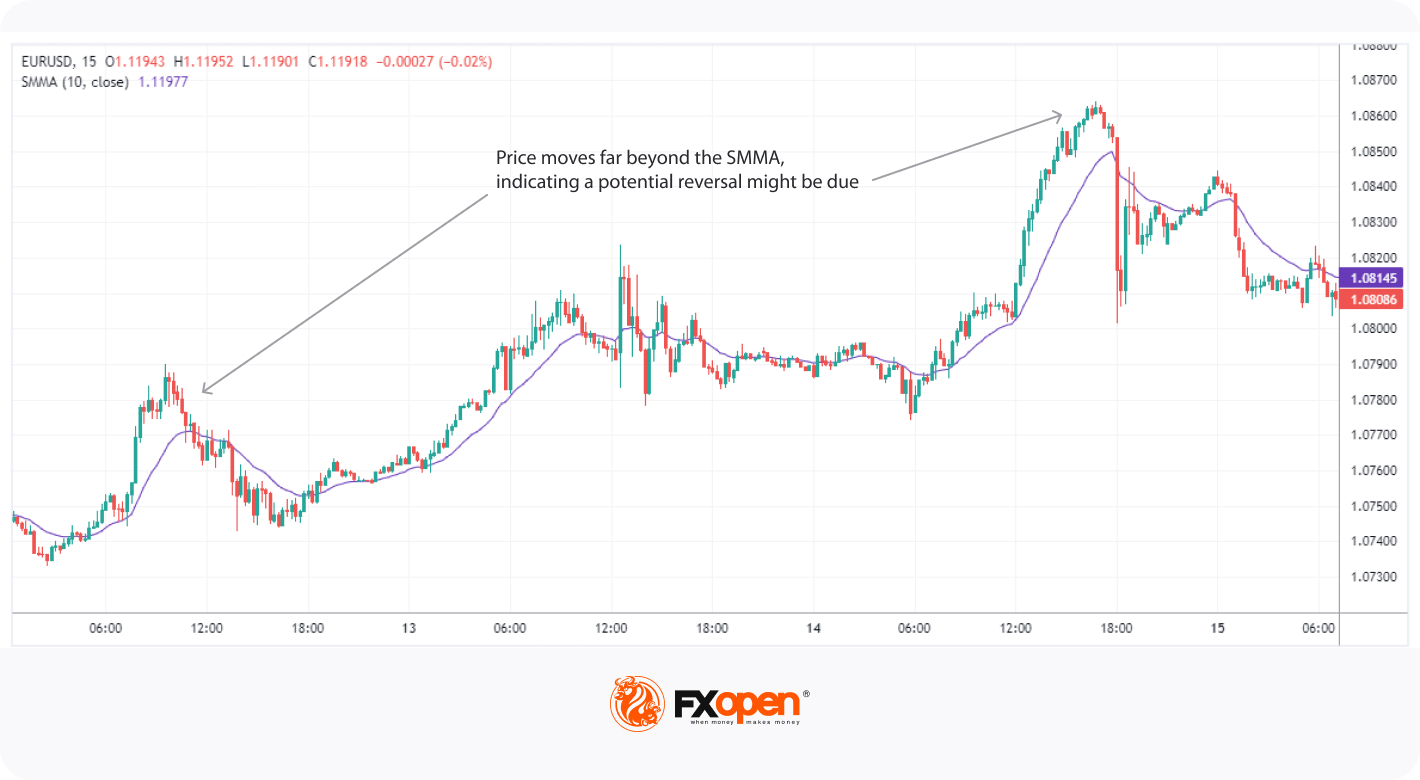
By evaluating where the current price stands in relation to the SMMA, traders can gauge the prevailing market sentiment. If the current value is significantly distant from the line, it might indicate an overbought or oversold scenario, prompting potential mean reversion scenarios.
Initialising the SMMA on a Trading Chart
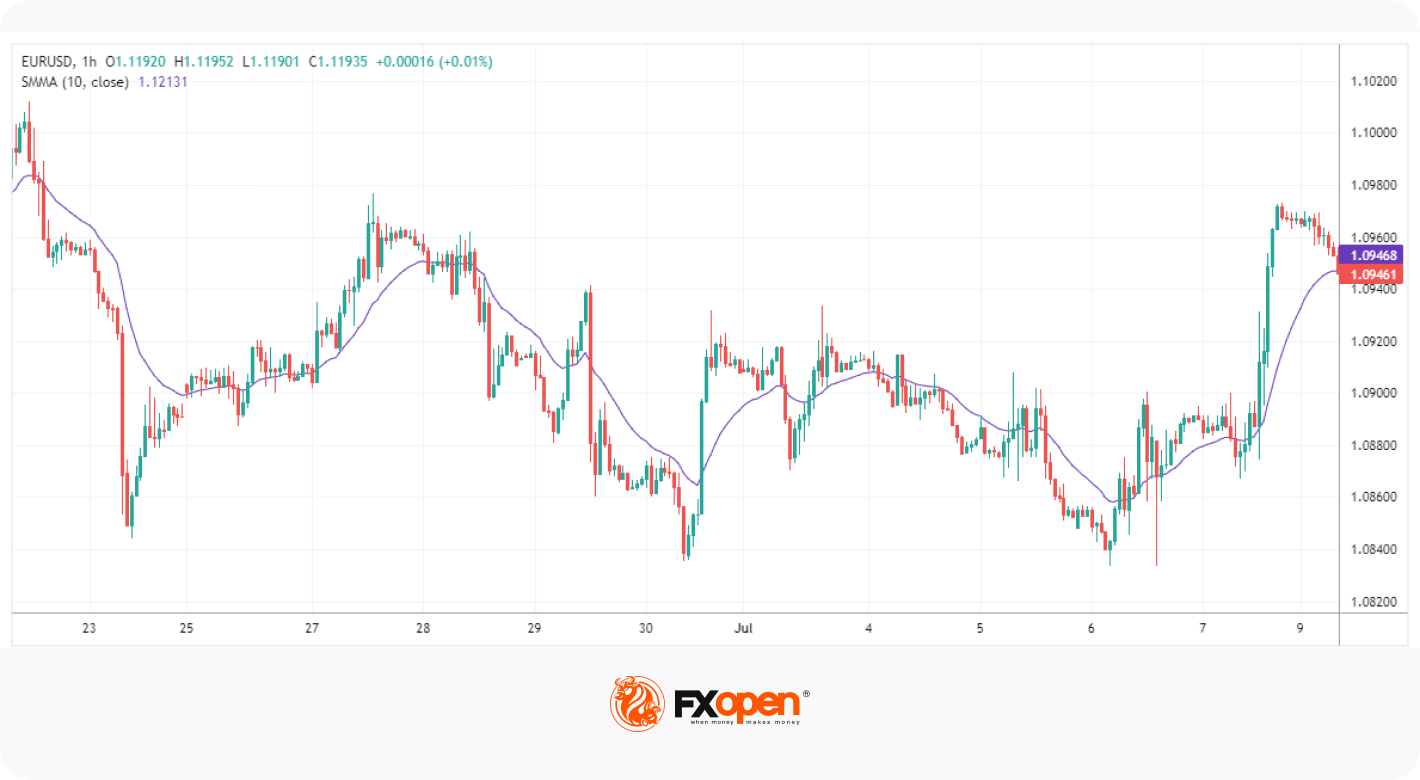
To start using the SMMA, head over to the free TickTrader platform, where you will find it under ‘Indicators’. For short-term trades, you can consider the length of 10-20; for longer-term perspectives, a 50-100 setting may be the most effective.
The Bottom Line
In summary, the SMMA is a solid alternative to more traditional moving averages. With this article, you now have a comprehensive overview of how this indicator works and its ability to help traders decipher trends and spot reversals. However, the smoother moving average has limitations as any other indicator and may provide incorrect signals; therefore, it’s vital to practise before you enter a live market. Once you are ready to test your newfound knowledge, you can open an FXOpen account and deploy your strategy across 600+ markets. Happy trading!
This article represents the opinion of the Companies operating under the FXOpen brand only. It is not to be construed as an offer, solicitation, or recommendation with respect to products and services provided by the Companies operating under the FXOpen brand, nor is it to be considered financial advice.
Stay ahead of the market!
Subscribe now to our mailing list and receive the latest market news and insights delivered directly to your inbox.


Latest articles

Intel at a Crossroads: Earnings Beat Meets Technical Resistance
Intel has just delivered its strongest quarter in over fifteen years, and the market reaction says it all. Q2 2026 revenue surged 25% year-over-year to $16.1 billion, crushing the consensus estimate of $14.42 billion, while adjusted EPS of

Tesla: Complex Range Structure Breaks Down Following Quarterly Earnings
Tesla released its Q2 2026 results after the market closed on 22 July. Revenue increased 26% year-on-year to $28.24 billion, while vehicle deliveries reached a record 480,126 units. However, operating margin fell sharply to 1.4%, down from

Pound Weakens After Soft UK Inflation Data as Euro Awaits Fresh Market Signals
The pound remains under pressure following the release of weaker-than-expected UK inflation data. The slowdown in inflation has strengthened expectations that the Bank of England could adopt a more accommodative policy stance in the coming months, weighing on sterling. Meanwhile,