


Relative Strength Index vs Stochastic Oscillator
FXOpen
Many traders believe the relative strength index and the stochastic oscillator are interchangeable. Actually, they are momentum oscillators that look similar and provide similar signals. However, their signals vary in terms of frequency and reliability. In this FXOpen guide, we will highlight the primary differences between the two indicators and explain how to use them effectively.
What Is the RSI Indicator?
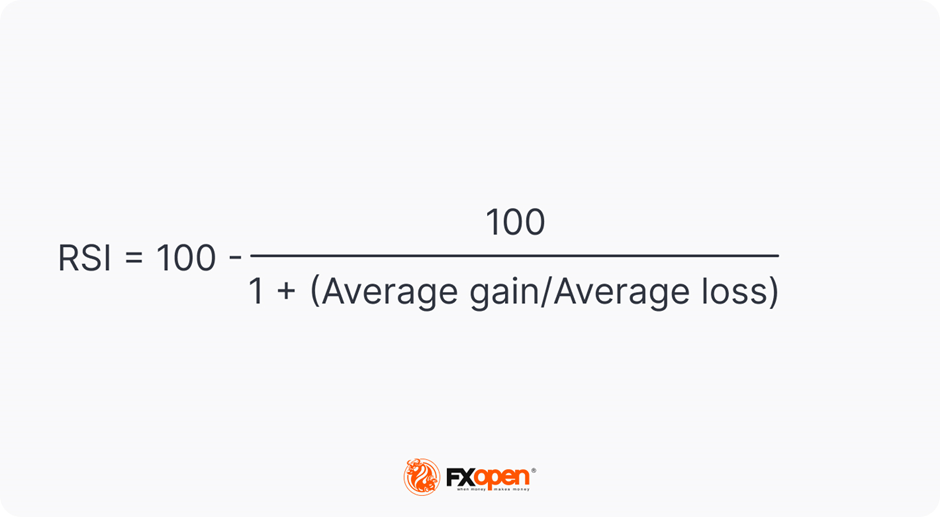
The relative strength index (RSI) was designed by J. Welles Wilder Jr. and introduced for the first time in 1978. Its calculation is based on a comparison of recent price gains to recent price losses. This calculation method allows for measuring the speed and magnitude of recent price fluctuations.
At first, the index was only used to identify overbought and oversold market conditions. Today, the indicator helps traders spot divergences between the oscillator and the price chart, find buy and sell signals, and predict market trends.
What Does the RSI Look Like?
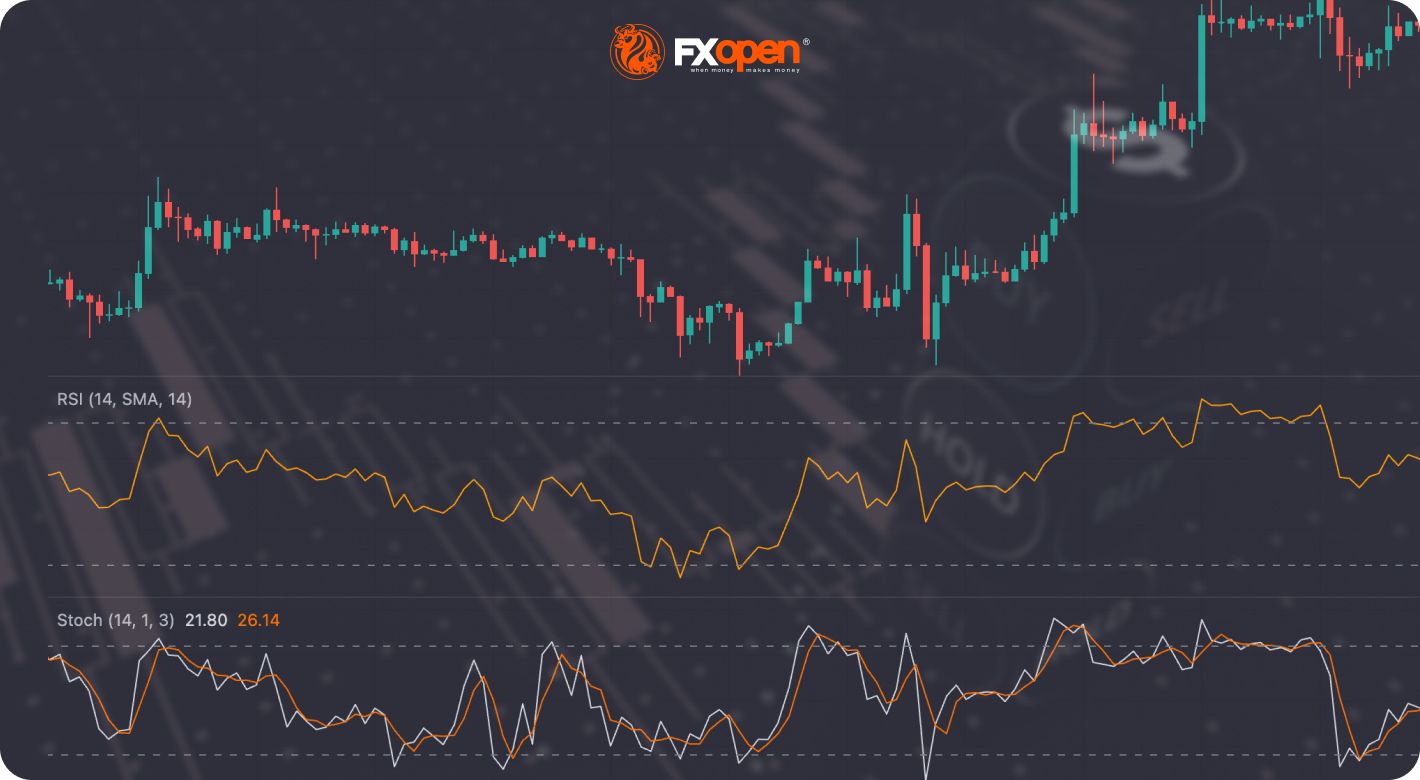
The relative strength index is plotted below the price chart. It consists of a single line that moves within a 0-100 range. 30 and 70 levels are the most important areas for identifying overbought and oversold conditions.
What Is the Stochastic Oscillator?
The stochastic oscillator is a momentum indicator that was presented by the financial analyst Dr George Lane in the late 1950s. Unlike the RSI, which compares the average gains and losses of a price, the stochastic is calculated by comparing the asset’s closing price to a range of prices over a specified period. The oscillator determines the strength of a price.
There are three types of stochastic oscillators: fast, slow, and full.
The full stochastic is the most common type, and its formula is:
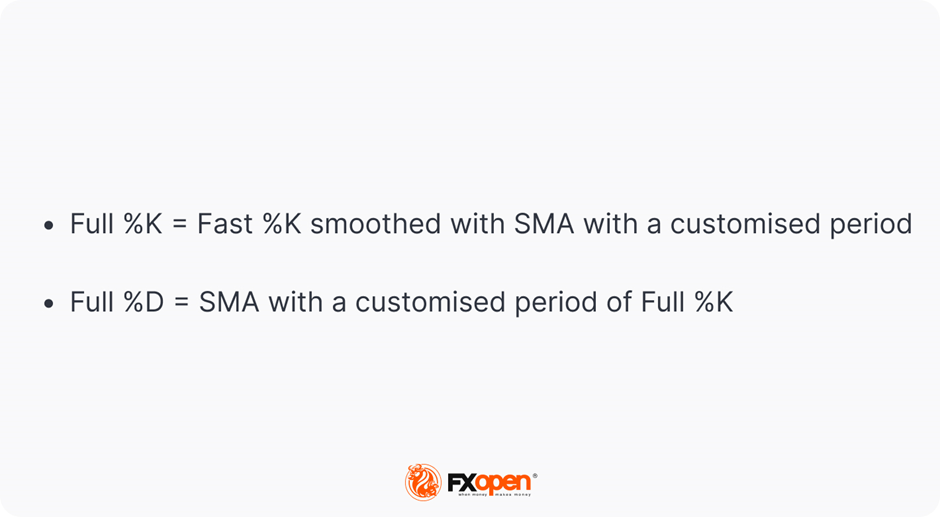
Where the fast %K line is calculated as (current close - lowest low)/ (highest high - lowest low) * 100
As with the relative strength index, the stochastic reflects overbought and oversold market conditions and divergences, provides buy and sell signals, and allows traders to forecast trends.
What Does the Stochastic Oscillator Look Like?
As the stochastic is an oscillator, it’s placed below the price chart. Unlike the RSI, it consists of two lines – %K and %D. They fluctuate between 0 and 100, with the primary levels being 20 and 80.
Stochastic Indicator vs RSI: Signals
The stochastic and the RSI provide similar signals. However, they can't be interchanged because the frequency and reliability of their alerts vary. Let's compare the primary use cases of both tools.
*We will use the standard settings of the indicators – the period of 14 for the RSI and 14, 3, 3 (%K, %D, Smooth) for the stochastic. You can open an FXOpen account and try other parameters.
Overbought/Oversold Conditions
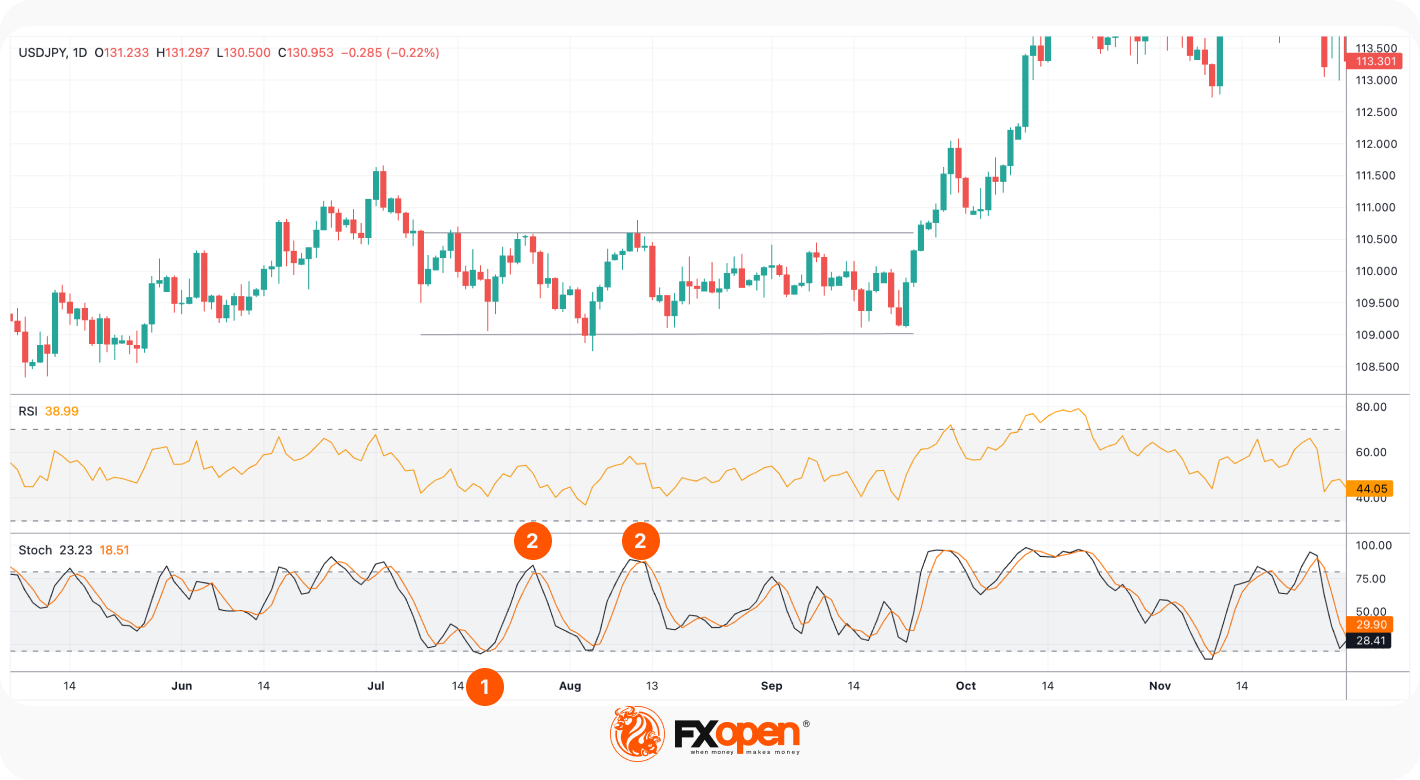
The relative strength index marks an overbought asset when it moves above 70. Conversely, it enters an area below 30 when the asset is oversold. The stochastic reflects overbought conditions when it’s above 80 and oversold conditions when it's below 20.
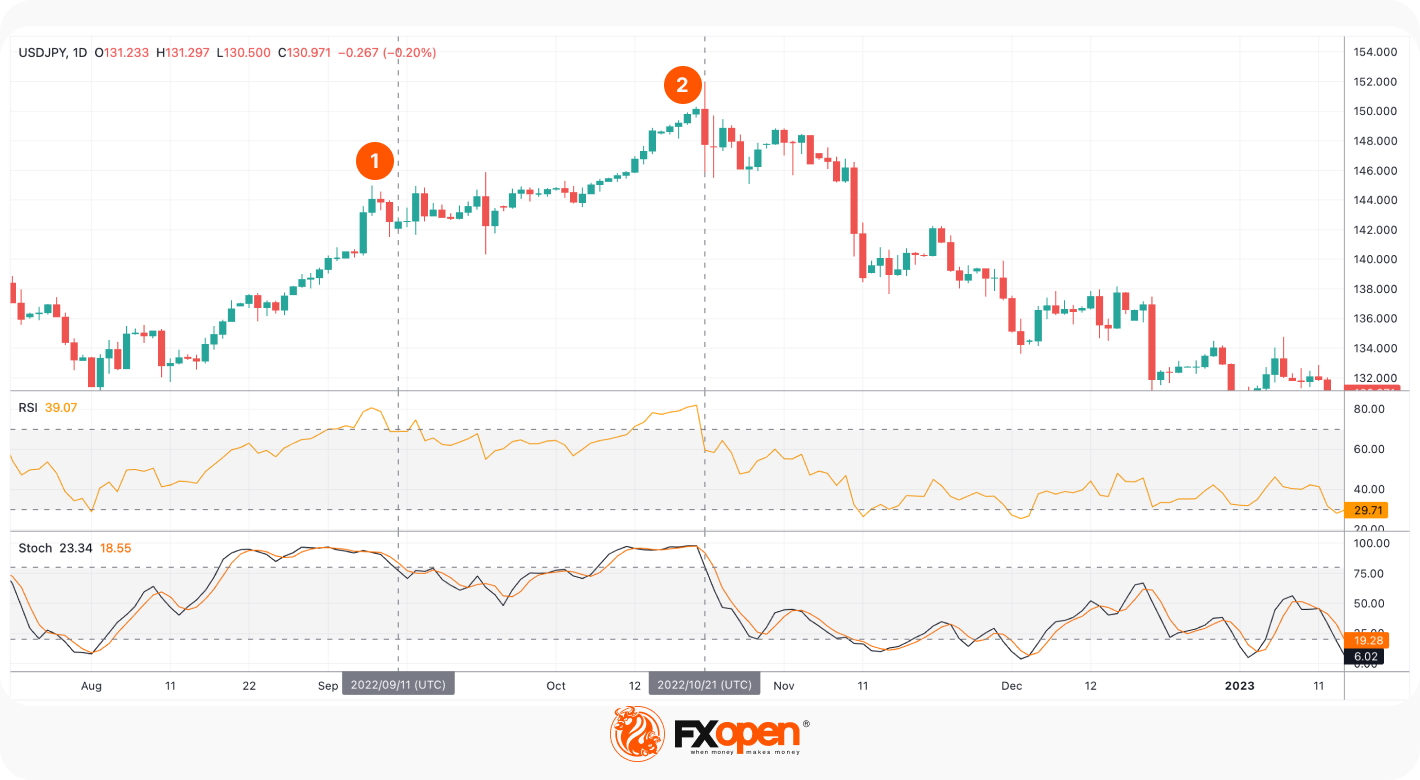
In the chart above, both indicators entered the overbought zone during a bullish trend (1 and 2). This could be considered a sign of a trend reversal. However, in the first case, both indicators failed as the USD/JPY pair continued moving upwards. In the second case, signals of both indicators were correct as the trend changed.
This example shows that both indicators aren’t very effective in a strong trend and must be used with other technical analysis tools to confirm the current trend's weakness.
Overbought/Oversold Conditions in a Ranging Market
Let’s consider whether the indicators work in a ranging market.
The chart above shows that the stochastic is more sensitive to price movements in a ranging market. When the price was fluctuating within a narrow range, the oscillator provided one buy signal and two sell signals. Although these didn’t predict a trend reversal, traders could use them to open short-term positions.
Divergence
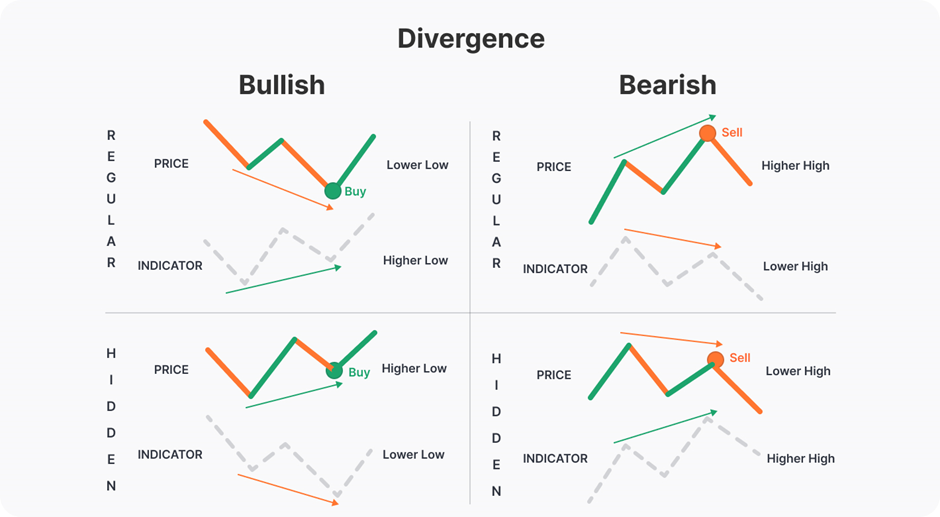
Let us remind you of common divergence rules.
Regular divergences – strong signal:
- Bullish. When the price sets a lower low, but the oscillator forms a higher low, the market will likely turn up.
- Bearish. When the price sets higher highs, but the oscillator doesn’t follow and sets lower highs, the market will likely turn down.
Hidden divergences – weak signal:
- Bullish. When the price forms higher lows, but the oscillator has lower lows, the market will likely move up.
- Bearish. When the price has lower highs, but the oscillator sets higher highs, the market will likely move down.
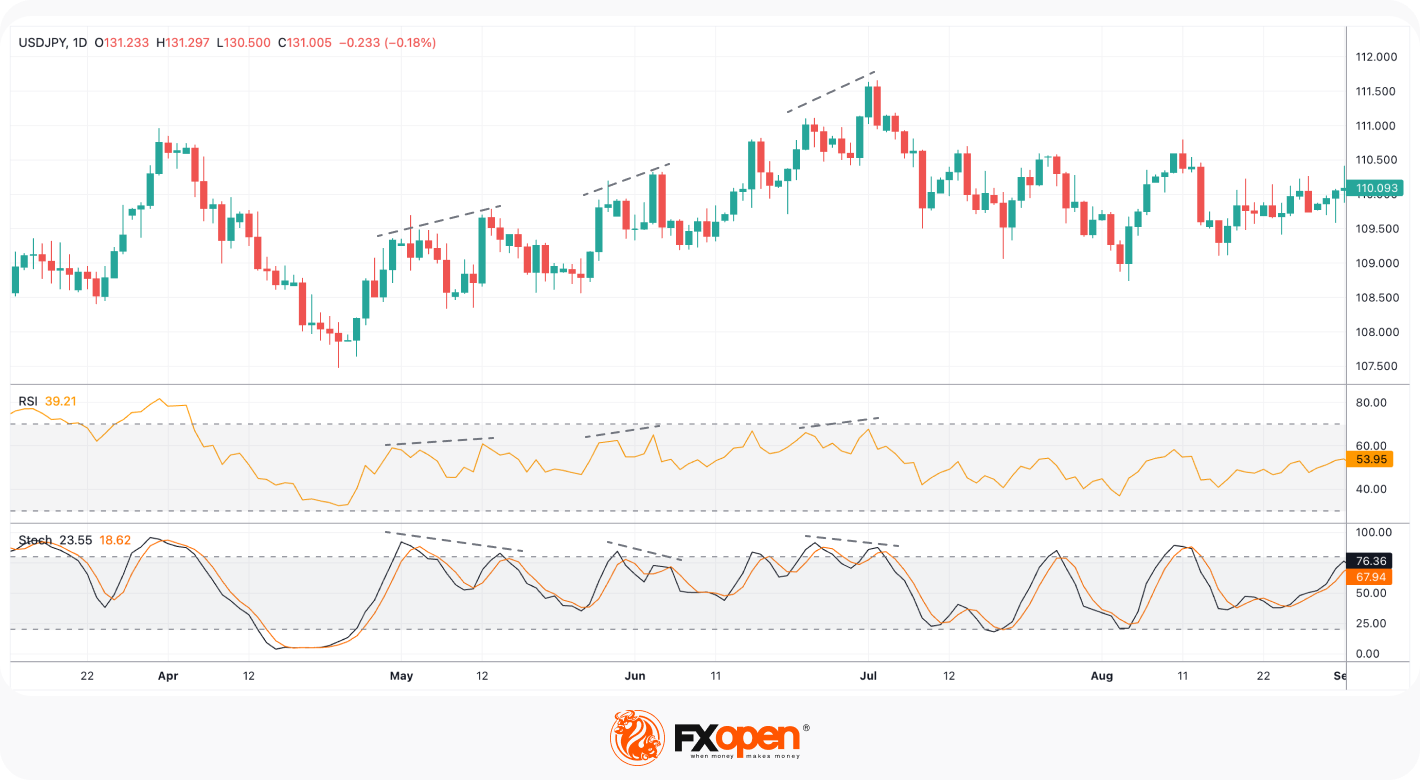
In the chart below, the price formed three divergences with the stochastic oscillator and 0 with the RSI. Although only the third case predicted a trend reversal, traders could use former alerts for short-term trades.
The relative strength index forms divergences with the price chart less frequently than the stochastic. This means that the stochastic oscillator is more effective for short-term trades.
Crossovers
The relative strength index can be used with a smoothed moving average. Their crossovers can help traders identify buy and sell opportunities.
In the stochastic oscillator, traders look for crossovers of the %K and %D lines.
- When the RSI (orange) breaks above the smoothed MA (grey), the price may rise. When the RSI falls below the MA, the price may fall.
- When the %K (black) breaks above %D (orange), the price may increase. Conversely, when it falls below %D, the price may decline.
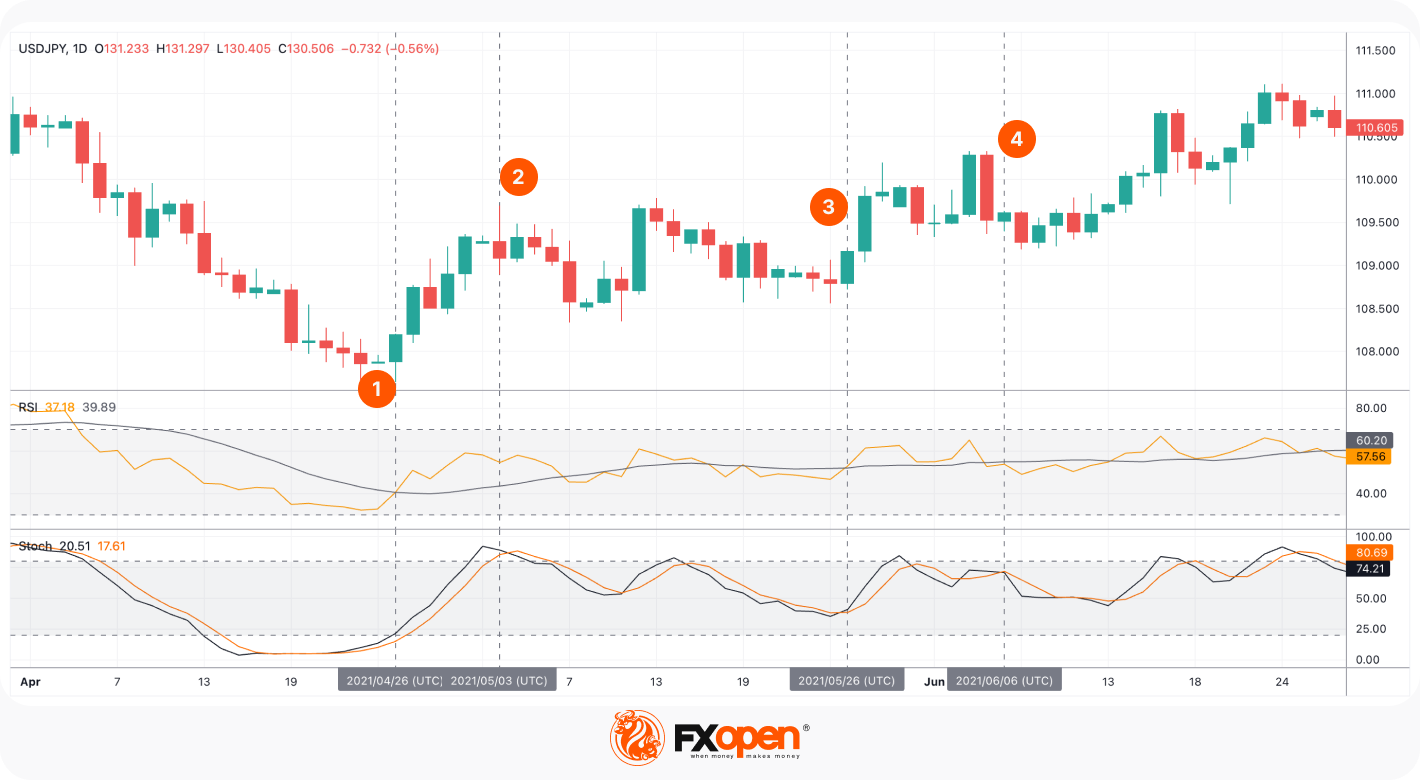
In the chart above, both indicators forecasted a surge in the asset’s value (1) when the RSI rose above the moving average and the stochastic left the oversold area with %K being above %D.
At point 2, the %K fell below %D, providing a sell signal. At the same time, the relative strength index was still above the MA.
At point 3, both indicators predicted a rise in the asset’s value. However, after that, the stochastic had two crossovers, and the relative strength index continued signalling an upward movement.
At point 4, traders got a sell alert from both indicators. However, the signal of the stochastic came later.
Considering the points above, it can be said that the stochastic provides short-term signals, while the RSI reflects the overall market direction when using crossovers.
What Is the Difference Between Stochastic and RSI? Summing Up
|
|
RSI |
Stochastic |
|
Appearance |
A single line fluctuating between 0
and 100, with key levels of 30 and 70 |
Two lines fluctuating within the 0-100
range, with key levels of 20 and 80 |
|
Settings |
A period of 14 |
%K – 14 Smooth – 3 |
|
Concept |
Measures the speed and
magnitude of recent price fluctuations |
Determines the strength of a price |
|
Overbought/oversold conditions in a
trending market |
Is not effective in a strong trend |
Is not effective in a strong trend |
|
Overbought/oversold conditions in a
ranging market |
Doesn’t provide signals |
Provides short-term signals |
|
Divergence |
Provides rare signals in a strong trend |
Provides short-term signals in a strong
trend |
|
Crossovers |
Reflects the overall market direction |
Provides short-term signals |
|
When to use |
Can be used for trend-reversal signals
|
Can be used in strong trends for short-term
trades |
Stochastic Oscillator vs RSI: Final Thoughts
The relative strength index and the stochastic oscillator have a lot in common. However, the stochastic is more sensitive to price fluctuations and is usually used for short-term trades, while RSI is more effective for long-term trading. Regardless of the signals, traders keep in mind that none of the indicators can be used without other technical analysis tools for confirmation. You can test various indicators on the TickTrader platform for free.
This article represents the opinion of the Companies operating under the FXOpen brand only. It is not to be construed as an offer, solicitation, or recommendation with respect to products and services provided by the Companies operating under the FXOpen brand, nor is it to be considered financial advice.
Stay ahead of the market!
Subscribe now to our mailing list and receive the latest market news and insights delivered directly to your inbox.


Latest articles

Tesla: Complex Range Structure Breaks Down Following Quarterly Earnings
Tesla released its Q2 2026 results after the market closed on 22 July. Revenue increased 26% year-on-year to $28.24 billion, while vehicle deliveries reached a record 480,126 units. However, operating margin fell sharply to 1.4%, down from

Pound Weakens After Soft UK Inflation Data as Euro Awaits Fresh Market Signals
The pound remains under pressure following the release of weaker-than-expected UK inflation data. The slowdown in inflation has strengthened expectations that the Bank of England could adopt a more accommodative policy stance in the coming months, weighing on sterling. Meanwhile,

Alphabet: Record Profit as Markets Await Their Verdict
On 22 July, Alphabet reported its Q2 2026 results, with revenue rising 24% year-on-year to $119.8 billion. Google Cloud revenue surged 82% to $24.77 billion, comfortably exceeding analysts' expectations. Search advertising generated $63.3 billion in revenue (+17%