


The Double Exponential Moving Average (DEMA): Is It a Powerful Tool for Technical Analysis?
FXOpen

Traders use various types of moving averages, including simple, weighted, linear-weighted, volume-weighted, and exponential. The uses are almost the same; however, they differ in terms of how they are calculated. This determines the frequency and accuracy of trading signals. In this FXOpen article, the DEMA indicator is explained – we will discuss its use cases and compare it to other types of the moving average.
What Is a Double Exponential Moving Average (DEMA)?
What is a DEMA indicator? Developed by Patrick Mulloy in 1994, DEMA is a popular tool used to smooth out price fluctuations and identify trends in financial markets.
DEMA is a type of moving average that applies a unique calculation methodology to reduce lag and be a more responsive indicator for traders. Unlike the Simple Moving Average (SMA) or Exponential Moving Average (EMA), DEMA aims to eliminate the shortcomings associated with delayed signals by incorporating two levels of exponential smoothing.
The meaning of DEMA in a stock market doesn’t differ from that in forex, commodity, or ETF markets. You can use this indicator to trade numerous assets on different timeframes.
How to Build the Double Exponential Moving Average
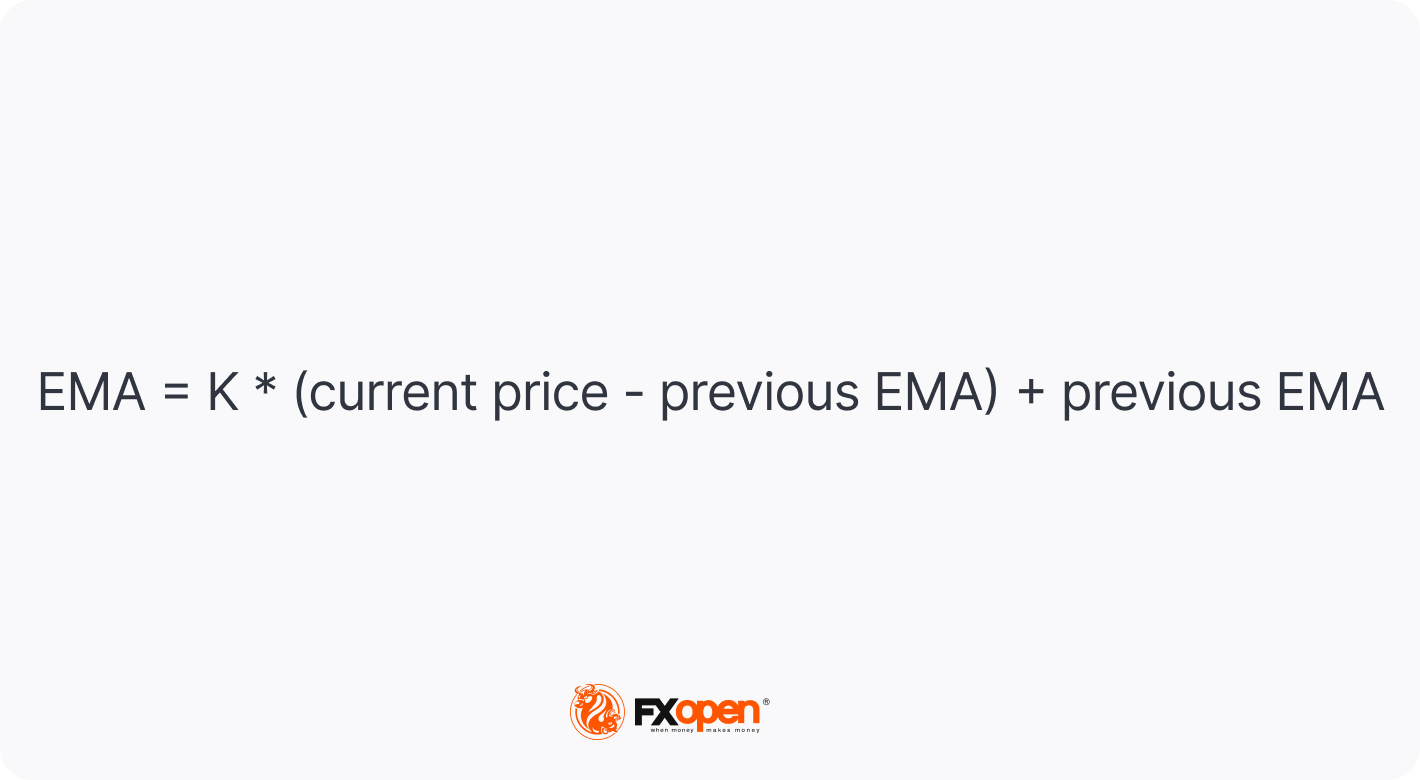
To calculate the DEMA, we need to understand the basic concepts of exponential moving averages (EMA). The EMA places more weight on recent prices, making it more responsive to price changes than the SMA.
The formula for calculating a single EMA is as follows:
The double exponential moving average formula is:
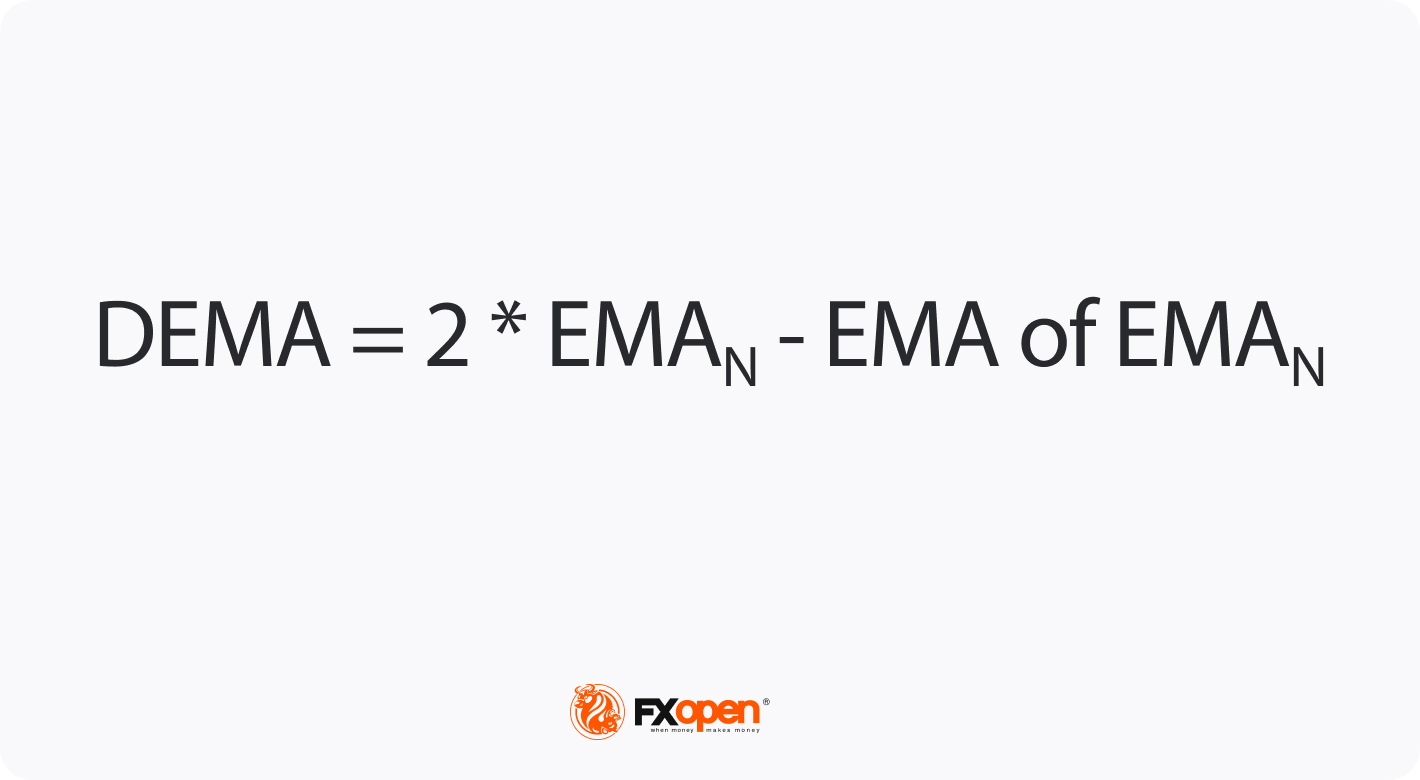
We need to:
- Calculate the single EMA (1) of the closing prices using the desired period (e.g., 9)
- Calculate the EMA (2) of the EMA (1) with the same period as the EMA (1) obtained in step 1
- Multiply the EMA (1) by 2
- Subtract the EMA (2) from the result in step 3
Fortunately, you don’t need to calculate the EMA or the DEMA manually. The free TickTrader platform provides numerous technical analysis indicators, including the DEMA, and adds them onto the chart automatically according to the periods you choose in settings.
How to Use the Double Exponential Moving Average In Trading
If you have ever used moving averages in trading, you will find learning how to use the DEMA easy. Here are a few common applications:
Trend Identification
The DEMA allows traders to determine the direction of the overall trend. When the DEMA line is sloping upward and the price is above it, it suggests an uptrend, whereas a downward-sloping DEMA with a price below it indicates a downtrend. Traders can use this information to enter or exit positions accordingly.
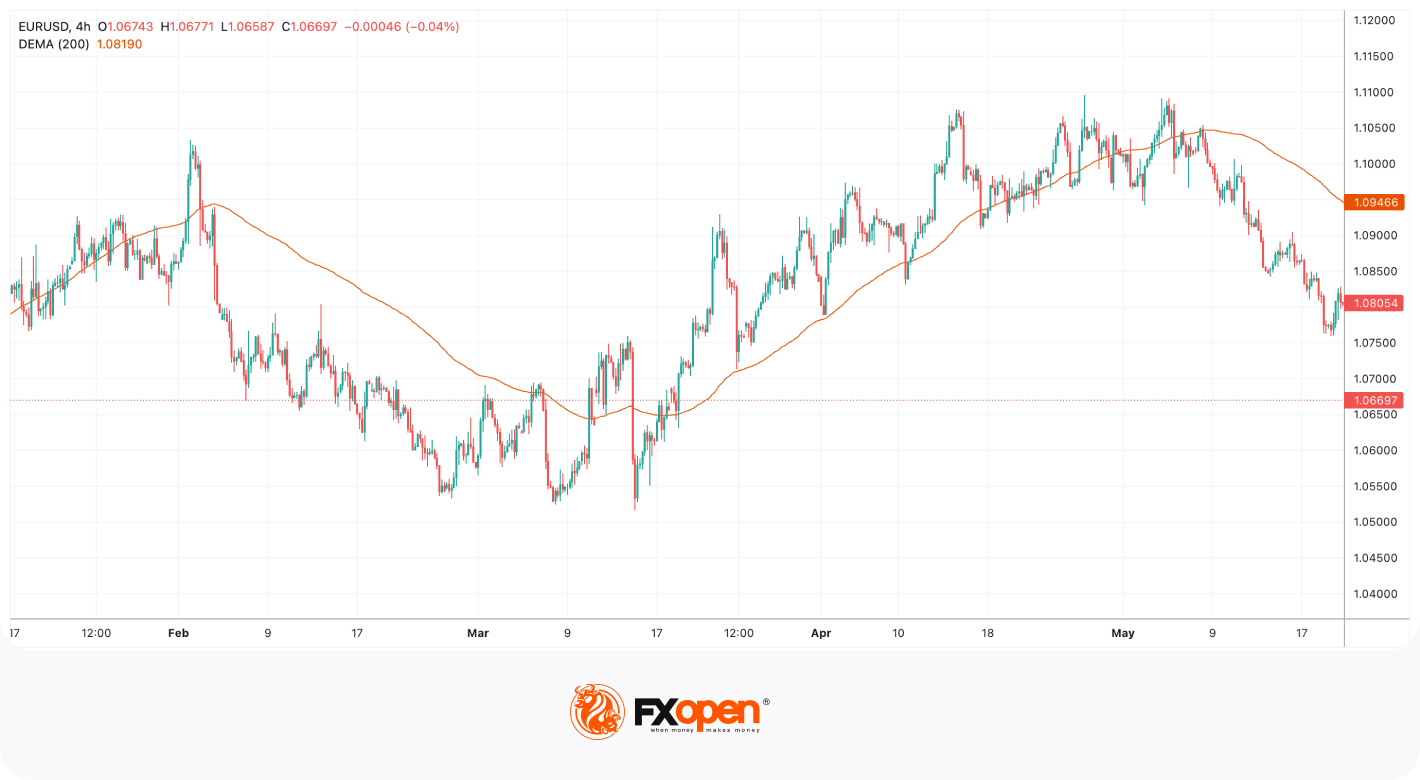
In the chart above, we can see a confirmation of this rule. However, it’s worth noting that the effectiveness of the double exponential moving average will depend on the period you choose. The shorter the period, the more often the price crosses the indicator. This may lead to early exits or incorrect entries.
Crossovers
DEMA crossovers can provide trading signals. When the line with a shorter period breaks above the line with a longer one, the price will likely move in an uptrend (1). Conversely, when the line with a shorter period breaks below a line with a longer one, the price will likely decline (2).
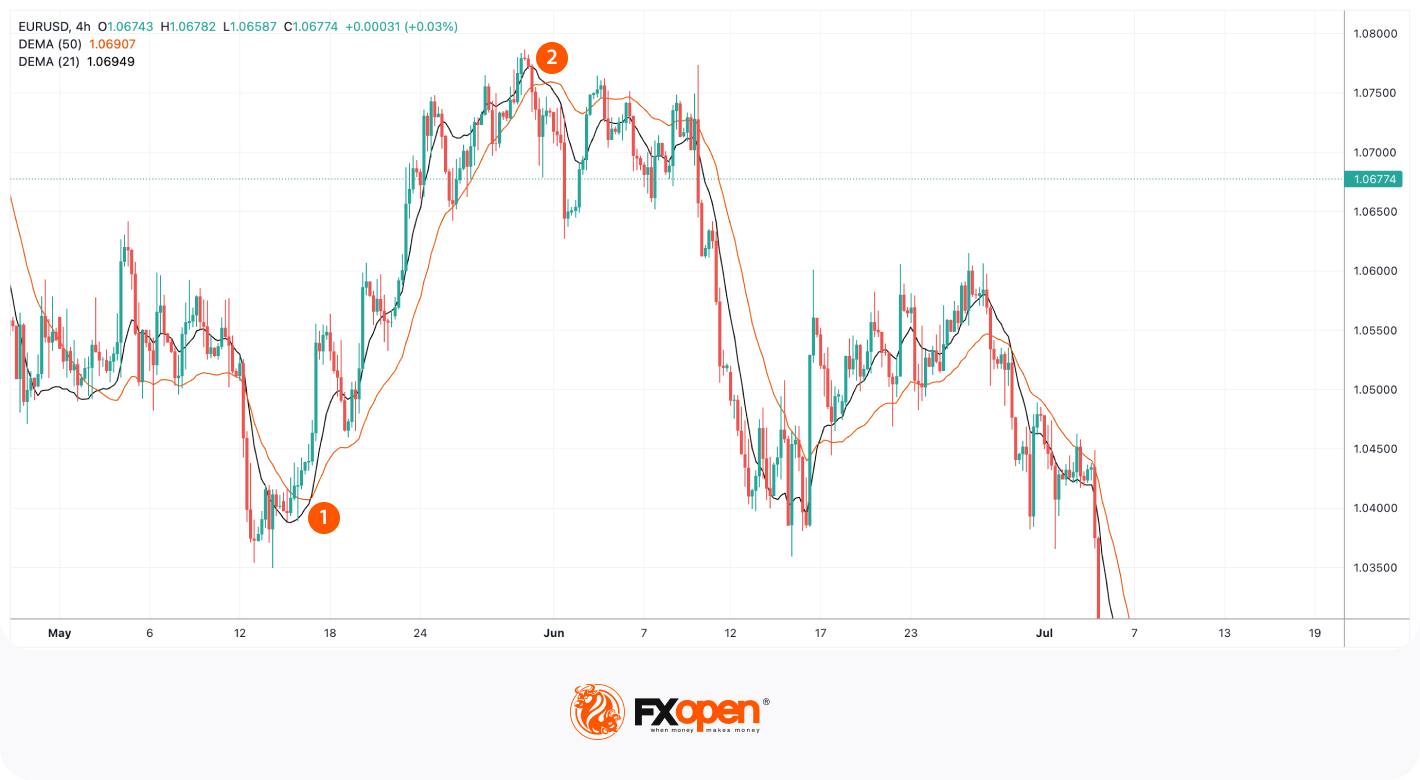
However, it’s important to remember that the frequency of crosses depends on periods. In the previous example, we used the DEMA with a period of 100 on the H4 chart. In this example, we shortened periods to lower the time lag between a trend change and DEMAs signals.
Support and Resistance Levels
DEMA can act as dynamic support or as resistance levels. When prices approach the DEMA line from above, it may act as a support level, indicating a potential buying opportunity. Conversely, when prices approach the DEMA line from below, it may act as a resistance level, suggesting a potential selling opportunity.
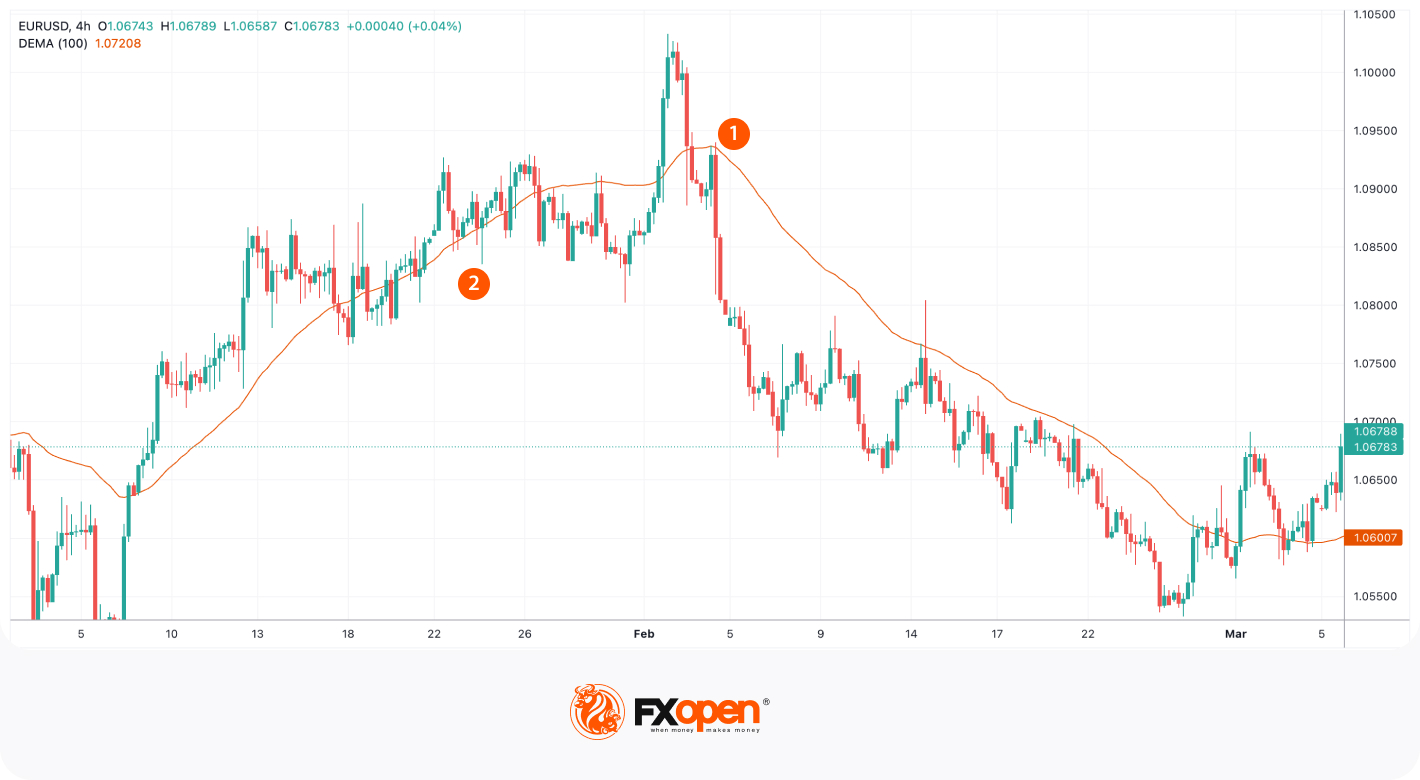
In the chart above, the price touched the double exponential moving average twice in a downtrend and served as a resistance level (1). However, it wasn’t so effective in the preceding uptrend (2), where the price crossed the indicator several times. Frequent crosses usually reflect an upcoming trend reversal.
Double Exponential Moving Average vs the Triple Exponential Moving Average
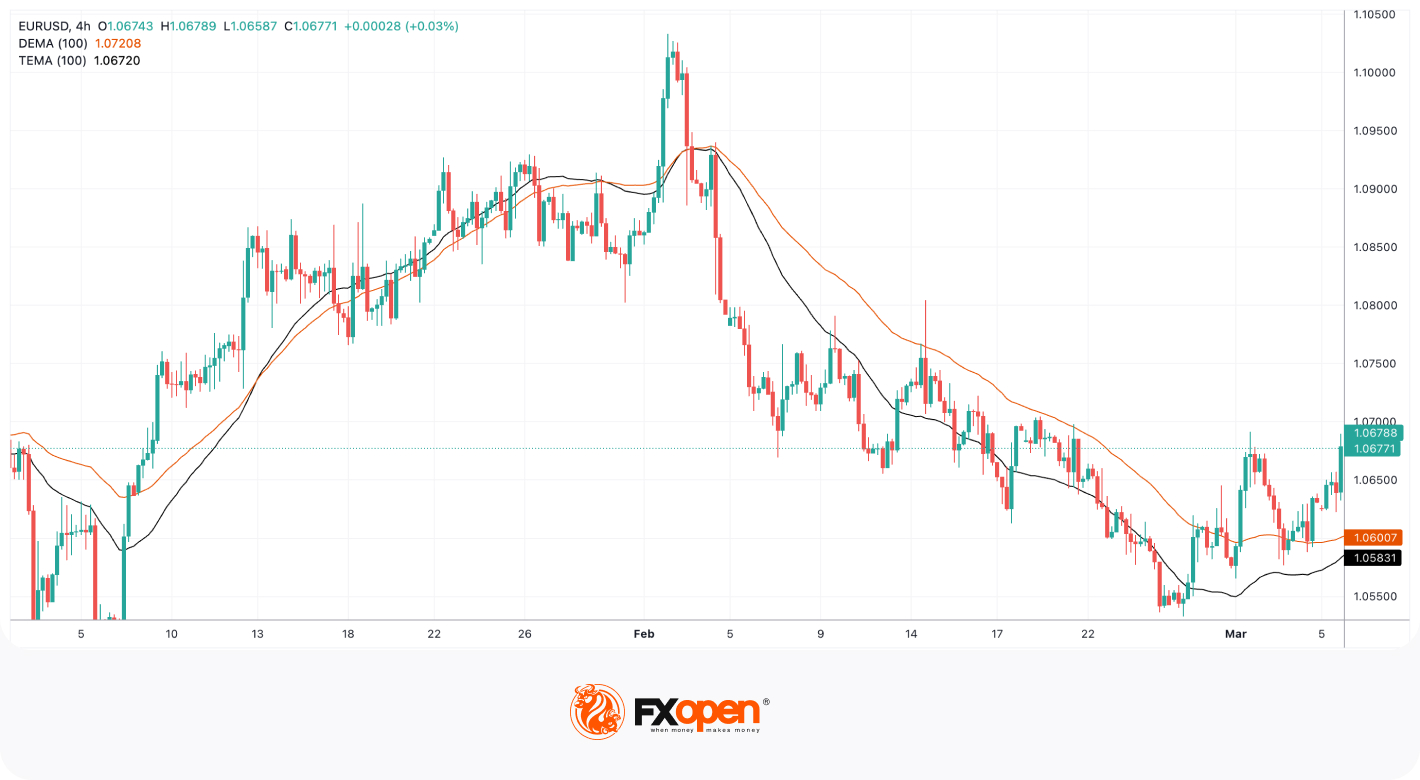
While DEMA (orange in the chart below) is effective in reducing lag and providing timely signals, another advanced indicator known as the triple exponential moving average (TEMA) takes it a step further. TEMA (black in the chart below) applies three levels of exponential smoothing, making it even more responsive to price changes.
TEMA provides quicker signals than DEMA and is particularly useful for short-term traders or those seeking faster trend identification. However, the added responsiveness also increases the likelihood of false signals, requiring traders to exercise caution and employ additional confirmation tools.
Double Exponential Moving Average vs Simple Moving Average
The primary difference between the DEMA and a simple moving average (SMA) lies in their calculation methodologies and responsiveness to price changes.
SMA (black in the chart below) calculates the average price over a specific period by simply summing up the closing prices and dividing them by the number of periods. It provides a smoothed line that represents the average price over the selected timeframe; however, SMA is prone to lag and can be slow to react to sudden price movements.
On the other hand, the DEMA (orange in the chart below) incorporates exponential smoothing, which places more weight on recent prices and reduces the lag associated with SMA. The responsiveness of the double exponential moving average makes it particularly useful for traders who want to identify trends early and take advantage of timely entry and exit points. It helps reduce the impact of lag and provides a more accurate representation of the current market conditions.

Limitations of the Double Exponential Moving Average
While DEMA offers several benefits, it is important to be aware of its limitations as well. Here are some key considerations:
- False Signals: Like any technical indicator, DEMA is not foolproof and can generate false signals. Rapid price fluctuations or ranging markets can lead to incorrect signals.
- Market Volatility: DEMA's responsiveness to price changes can be both an advantage and a disadvantage. In highly volatile markets, the indicator may provide excessive signals, leading to confusion and potentially incorrect trading decisions.
- Parameter Sensitivity: The effectiveness of DEMA is highly dependent on selecting appropriate parameters, such as the period length. Different financial instruments and timeframes may require different DEMA settings for optimal performance. Traders conduct thorough testing and analysis to determine the most suitable parameters for their specific trading strategy.
- Subjectivity: Interpreting DEMA, like any technical indicator, involves subjective analysis. Traders may have different interpretations of trend lines, crossovers, and support/resistance levels.
Final Thoughts
The double exponential moving average is a powerful tool for technical analysis, offering reduced lag and increased responsiveness compared to traditional moving averages. By smoothing out price fluctuations and providing timely signals, DEMA can assist traders in identifying trends and spotting potential entry and exit points. However, it’s vital to consider its limitations before making trading decisions. What is the DEMA in a share market or in forex? To learn this, you can open an FXOpen account and put your knowledge into practice.
This article represents the opinion of the Companies operating under the FXOpen brand only. It is not to be construed as an offer, solicitation, or recommendation with respect to products and services provided by the Companies operating under the FXOpen brand, nor is it to be considered financial advice.
Stay ahead of the market!
Subscribe now to our mailing list and receive the latest market news and insights delivered directly to your inbox.


Latest articles

GBP/CHF: Trendline or RSI — Which One Is Lying?
Sterling enters this week on firmer footing, with political uncertainty fading fast after Andy Burnham's confirmation as Labour leader eased investor concerns over the succession to Keir Starmer. Markets reacted further to reports pointing to Shabana Mahmood as the frontrunner

Silver Attempts to Break Out of Its Range
Silver continues to balance between its dual role as an industrial metal and so-called refuge asset, and this combination largely explains the lack of a clear trend in recent weeks. Shifting expectations for central bank interest rates can influence the

Nasdaq 100: Is This the Correction Traders Have Been Waiting For?
The Nasdaq 100 (US Tech 100 Mini on FXOpen) remains caught between two opposing forces: cooling inflation on one side, and persistent geopolitical instability on the other. On 14 July, June's CPI print came in softer than expected, easing near-term