


Understanding the Triple EMA Indicator for Enhanced Trend Analysis in Financial Markets
FXOpen
The triple exponential moving average (TEMA) is a commonly used indicator in price action trading that is applied in conjunction with other technical analysis tools. The TEMA is known for providing signals by applying multiple calculations to the EMA values, making it a valuable tool for traders seeking enhanced trend analysis in financial markets. This FXOpen article will explore the triple EMA strategy and elaborate on it in terms of technical trading.
What Is the Triple EMA?
The triple exponential moving average (TEMA) is a technical indicator used to analyse price trends and smooth out price data. It is a variation of the traditional exponential moving average (EMA) that aims to provide more accurate and responsive signals.
The TEMA achieves this by applying multiple calculations to the EMA values. It calculates the single EMA (1), the EMA (2) of the initial EMA, and the EMA (3) of the EMA (2). The result is a moving average that responds quickly to price changes while reducing noise and providing a smoother representation of the underlying trend.
Here is the formula to calculate the TEMA:
(3∗EMA1) − (3∗EMA2) + EMA3,
Where:
EMA1 – the initial exponential moving average
EMA2 – EMA of EMA1
EMA3 – EMA of EMA2
What Does the TEMA Tell You?
The triple EMA provides traders with valuable information regarding trend direction, crossover signals, and support and resistance levels. Here's what TEMA tells you in each of these contexts:
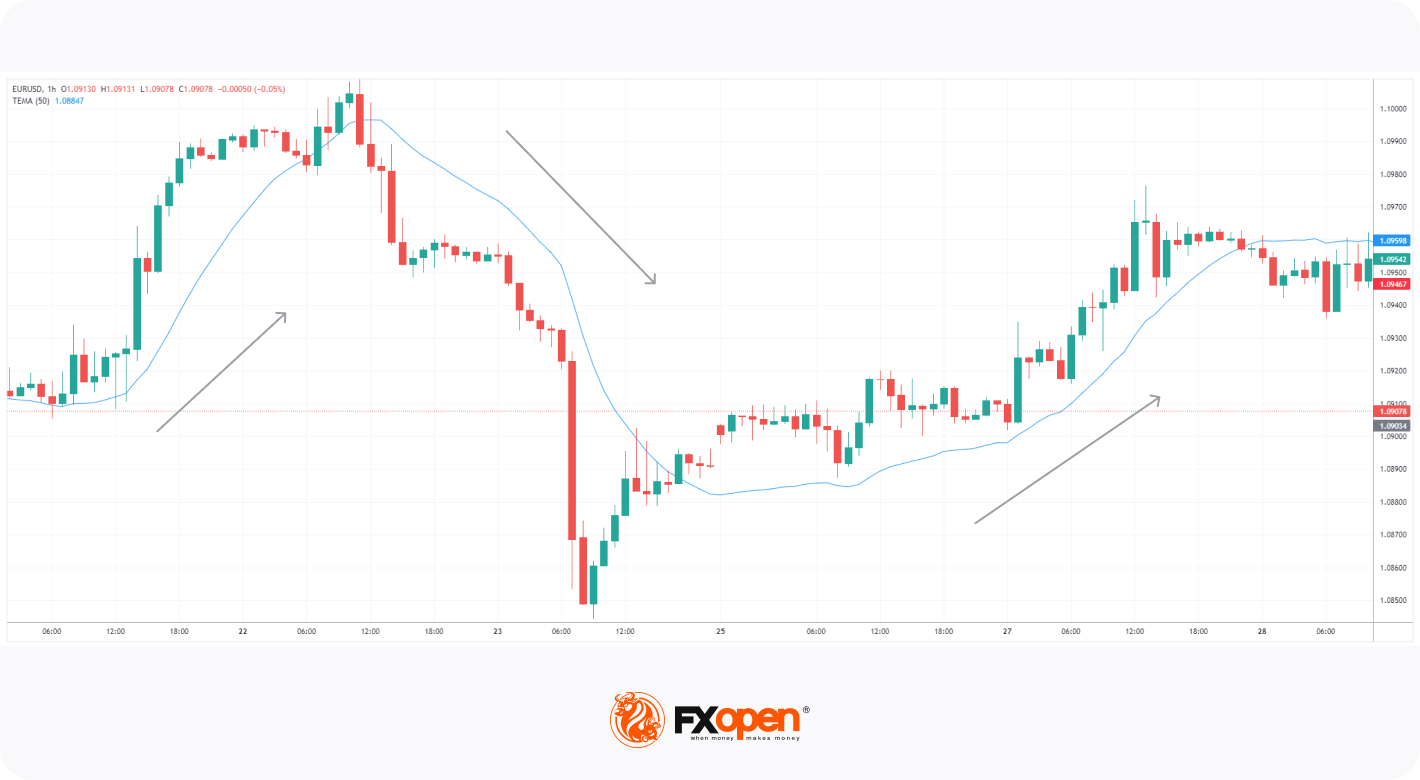
- TEMA and Trend Direction: By observing the slope of the TEMA line, traders may determine whether the market is experiencing an uptrend or a downtrend. An upward-sloping TEMA line with prices above it suggests an uptrend, indicating that prices are generally rising. Conversely, a downward-sloping TEMA line with prices below it indicates a downtrend, where prices are generally declining.
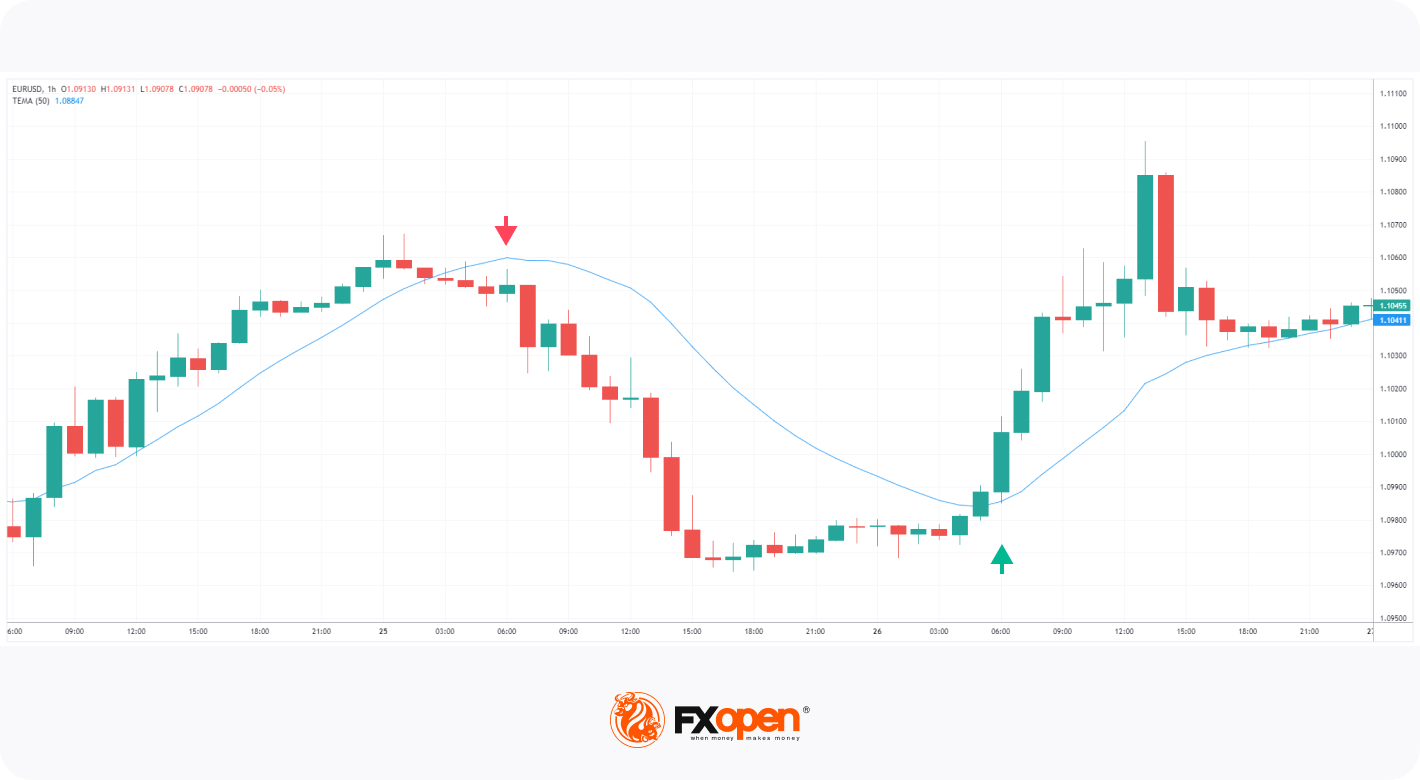
- TEMA Crosses: The triple EMA crossover strategy in forex and other markets also provides signals through its crossover points with the price line. When the price line crosses above the TEMA, it may indicate a bullish signal, suggesting an upcoming upward trend. Conversely, when the price crosses below the TEMA, it may highlight a sell signal before the formation of a downtrend.
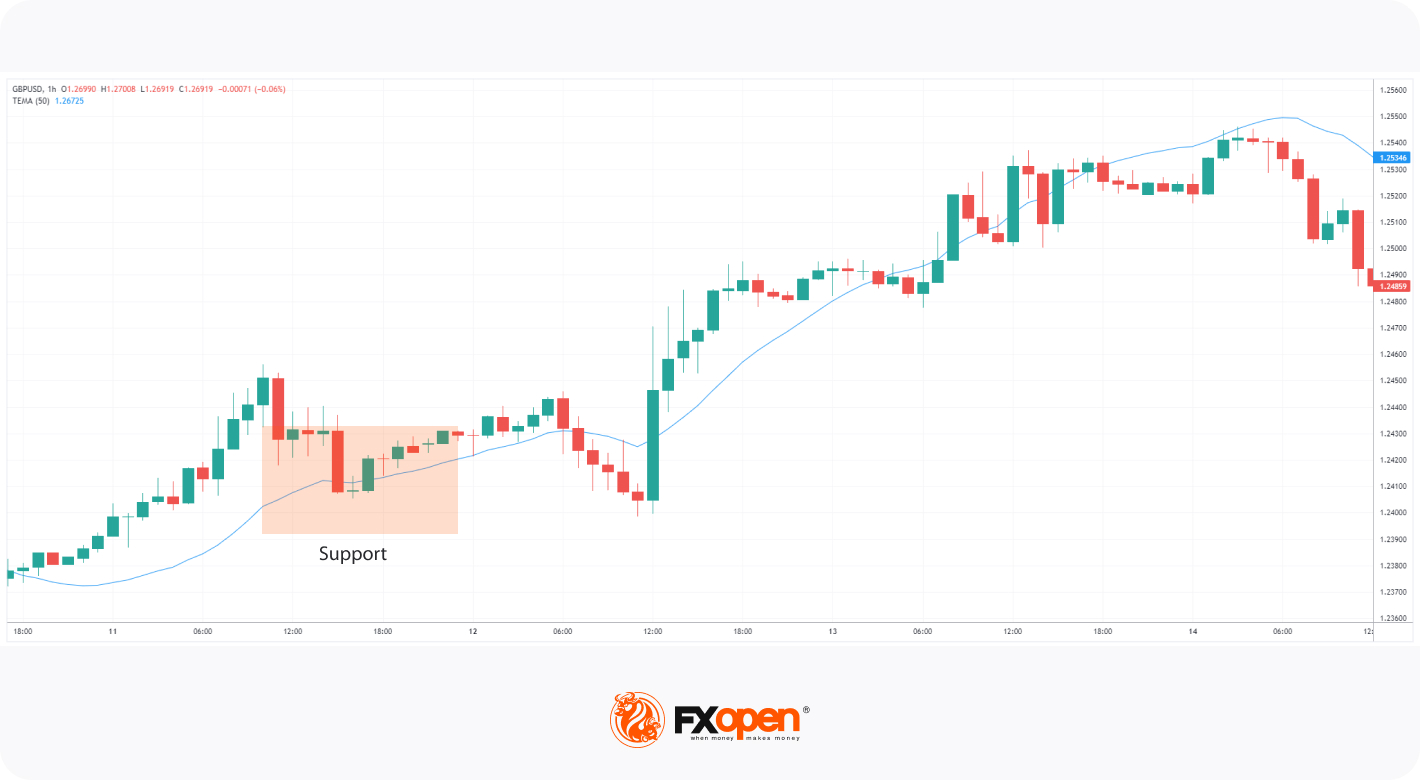
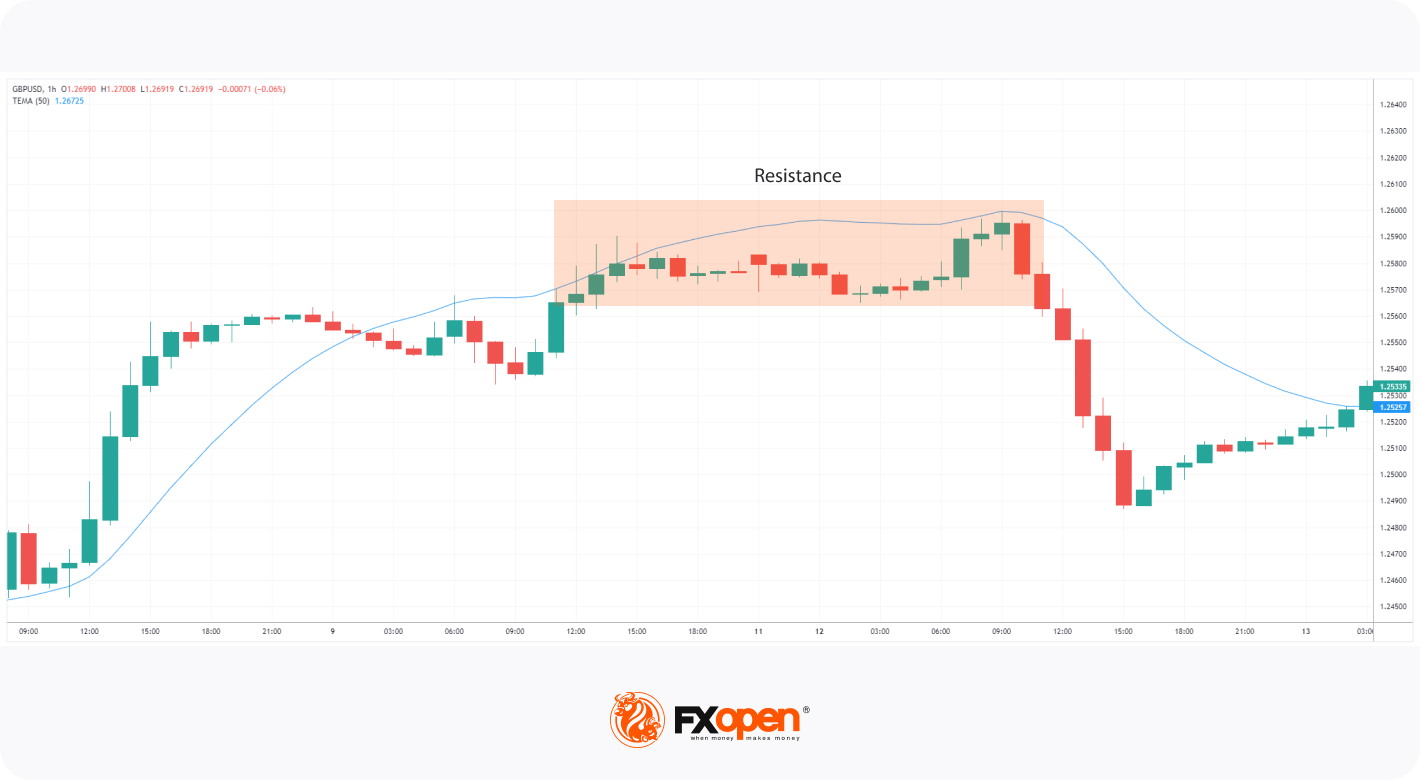
- TEMA for Support and Resistance: In addition to trend identification and triple EMA crossover signals, triple EMA in the FX and other markets can be used to identify support and resistance levels.
The line serves as dynamic support and resistance levels. When the price touches the moving average, it is supposed to rebound from it. A break of the line signals a potential trend reversal.
Note: it’s worth practising different TEMA parameters before entering a real market. Generally, the price crosses the TEMA with a longer period more rarely and is more effective on longer timeframes, while an TEMA with a shorter period intersects with the price more often and is more reliable for short-term trading.
After gaining a thorough understanding of the triple EMA, traders may open an FXOpen account to apply their newfound knowledge to the trading charts.
Double EMA vs Triple EMA
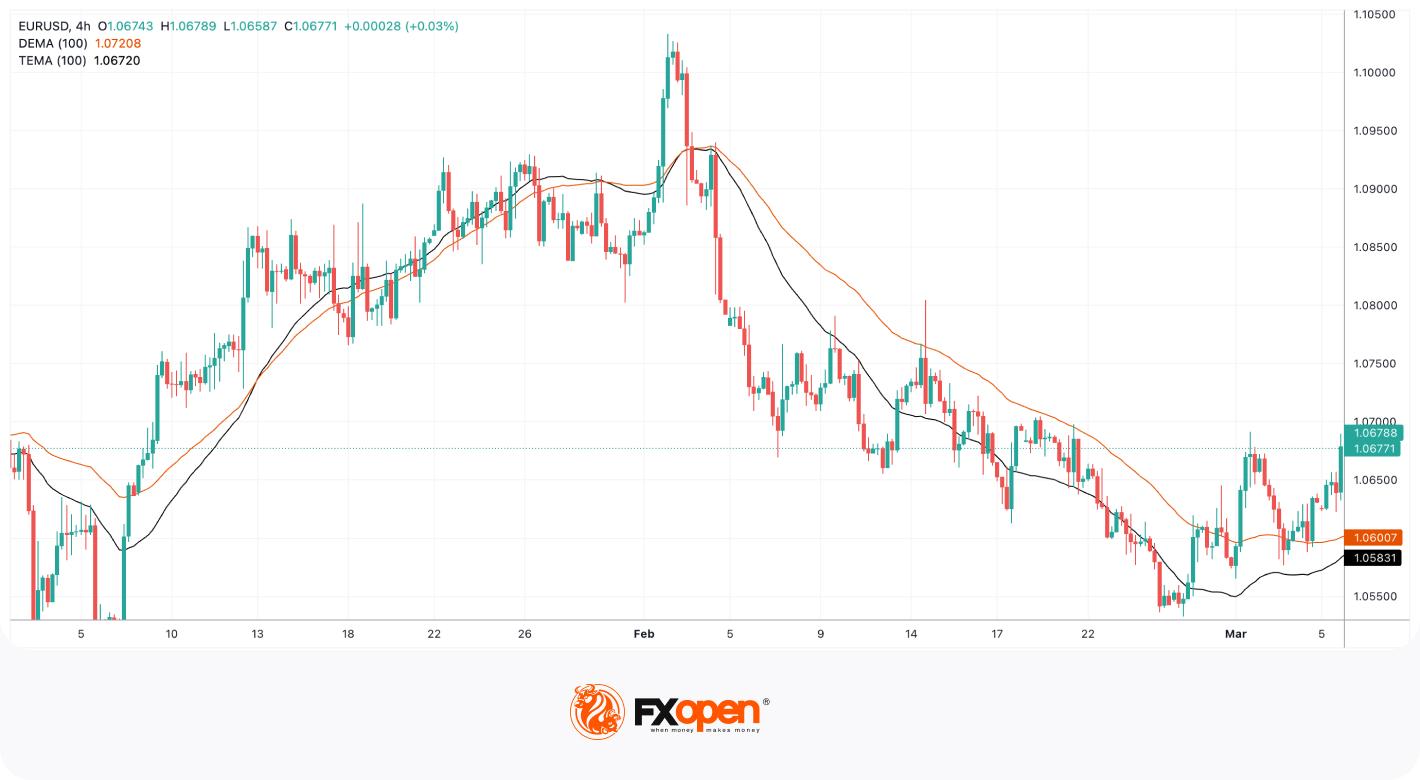
Here are the key differences between TEMA (black) and double moving average (DEMA) (orange):
- Calculation: The TEMA applies the EMA calculation three times, while the DEMA applies it twice. This difference in calculation affects the responsiveness and smoothness of the indicators.
- Responsiveness: The TEMA is more responsive to price changes than DEMA. This means that TEMA tends to generate signals earlier in response to market movements compared to DEMA.
- Smoothness: The DEMA is generally smoother than the TEMA. It provides a more stable moving average line that can help filter out short-term price fluctuations.
- Lag Reduction: Both double or triple EMAs aim to reduce the lag compared to the traditional exponential moving average. However, the TEMA typically has less lag due to its triple calculation.
Limitations of Using the TEMA
While the triple exponential moving average aims to reduce lag compared to other moving averages, it still shares some of the common issues faced by MAs. MAs are most effective in trending markets where prices are moving consistently in one direction. However, during choppy or range-bound periods, MAs, including TEMA, may provide little insight and generate false signals due to frequent crossovers without sustained price moves.
Reducing lag in indicators like the TEMA can be beneficial for certain traders, but not all. Some traders prefer a lagging indicator because they want to filter out minor price fluctuations and focus on significant trends. The quicker response of TEMA to changes means it closely tracks the price, potentially resulting in more frequent crossovers than a simple moving average (SMA). For investors who prefer a longer-term approach and avoid frequent trading, the TEMA may be an ineffective tool as they may be easily shaken out of positions.
Final Thoughts
Traders consider their trading strategies, risk tolerance, and preference for lag reduction when choosing between the TEMA and other moving averages. Use the triple EMA on the daily chart and other timeframes in conjunction with various technical analysis tools and indicators. You don’t need to download the triple-smoothed EMA; it’s available on the TickTrader platform by FXOpen. On the platform, you can use various tools to validate signals and trading strategies in the short and long term.
FAQ
Can the TEMA be used on different timeframes?
Yes, the TEMA can be used on various timeframes, including daily charts and other time intervals. The choice of timeframe depends on the trader's trading style and the overall trading approach.
How can I backtest and validate TEMA-based trading strategies?
To backtest and validate TEMA-based trading strategies, you need to collect historical price data, develop your strategy with defined rules and parameters, perform backtesting by applying the strategy to the historical data, analyse the performance using relevant metrics, validate the strategy through out-of-sample testing, optimise it if necessary, and implement risk management techniques to protect your capital. It's important to remember that backtesting has limitations and does not guarantee success in future performance, so caution should be exercised when implementing the strategy in live trading.
Are there any potential drawbacks or risks to using the TEMA?
Like any technical indicator, the TEMA is not foolproof and can generate false signals. Traders should be cautious, use risk management techniques, and consider other factors before making trading decisions based solely on TEMA signals.
This article represents the opinion of the Companies operating under the FXOpen brand only. It is not to be construed as an offer, solicitation, or recommendation with respect to products and services provided by the Companies operating under the FXOpen brand, nor is it to be considered financial advice.
Stay ahead of the market!
Subscribe now to our mailing list and receive the latest market news and insights delivered directly to your inbox.


Latest articles

GBP/CHF: Trendline or RSI — Which One Is Lying?
Sterling enters this week on firmer footing, with political uncertainty fading fast after Andy Burnham's confirmation as Labour leader eased investor concerns over the succession to Keir Starmer. Markets reacted further to reports pointing to Shabana Mahmood as the frontrunner

Silver Attempts to Break Out of Its Range
Silver continues to balance between its dual role as an industrial metal and so-called refuge asset, and this combination largely explains the lack of a clear trend in recent weeks. Shifting expectations for central bank interest rates can influence the

Nasdaq 100: Is This the Correction Traders Have Been Waiting For?
The Nasdaq 100 (US Tech 100 Mini on FXOpen) remains caught between two opposing forces: cooling inflation on one side, and persistent geopolitical instability on the other. On 14 July, June's CPI print came in softer than expected, easing near-term