


Trading Breakouts and Pullbacks: Trading Strategies
FXOpen
Navigating the volatile world of trading requires sharp instincts and well-strategised techniques. Breakouts and pullbacks are key concepts in trading, and understanding these principles can enhance trading outcomes. This article delves into four strategies, offering practical entry and exit criteria, and provides valuable insights for trading range breakouts and pullbacks.
To test these strategies out for yourself, head over to FXOpen’s free TickTrader platform. There, you’ll find a wide range of markets to practise on.
What Is a Breakout?
A breakout refers to a price movement beyond an established trading range or technical pattern. This can be either above a resistance level or below a support level. In the world of trading, a breakout signifies a potential shift in market sentiment. When prices breach a previously defined boundary, it often indicates a potential continuation or reversal of the current trend.
Breakouts can be triggered by various factors, including fundamental news, economic data releases, or increased trading volume. For traders, learning how to get involved in genuine breakouts instead of mistakenly trading false breakouts can provide valuable trading opportunities.
What Is a Pullback?
A pullback is a temporary reversal in the direction of an asset's prevailing trend, typically seen as a short-term decline during an uptrend or a brief rally in a downtrend. It's akin to a market "taking a breather" before resuming its primary trajectory. Pullbacks can be the result of profit-taking, market corrections, or other short-lived changes in traders' sentiments. For traders, pullbacks are critical because they often present prime buying (in an uptrend) or selling (in a downtrend) opportunities.
A Basic Breakout Strategy

Breakouts suggest a change in market sentiment and can offer compelling trading opportunities. A common strategy traders employ is to look for breakouts beyond a certain range, especially when accompanied by high volume. The high volume provides additional confirmation of the strength of the breakout. This strategy can offer clear entry and exit criteria:
Entry/Exit Criteria
Entry
- Bullish Breakout: When the price closes above the established range on high volume, traders may consider going long.
- Bearish Breakout: If the price closes below the range on high volume, a short position may be feasible.
Stop Losses
- Bullish Breakout: Traders may set a stop loss just below a key swing point or beyond the lower side of the range.
- Bearish Breakout: You can consider placing a stop loss slightly above a pivotal swing point or beyond the upper boundary of the range.
Take Profits
- Traders can opt to take profits when the price hits a significant resistance (for bullish breakouts) or support level (for bearish breakouts). Another approach is to exit the position when there's evidence of the trend slowing or reversing.
A Breakout Retest Strategy
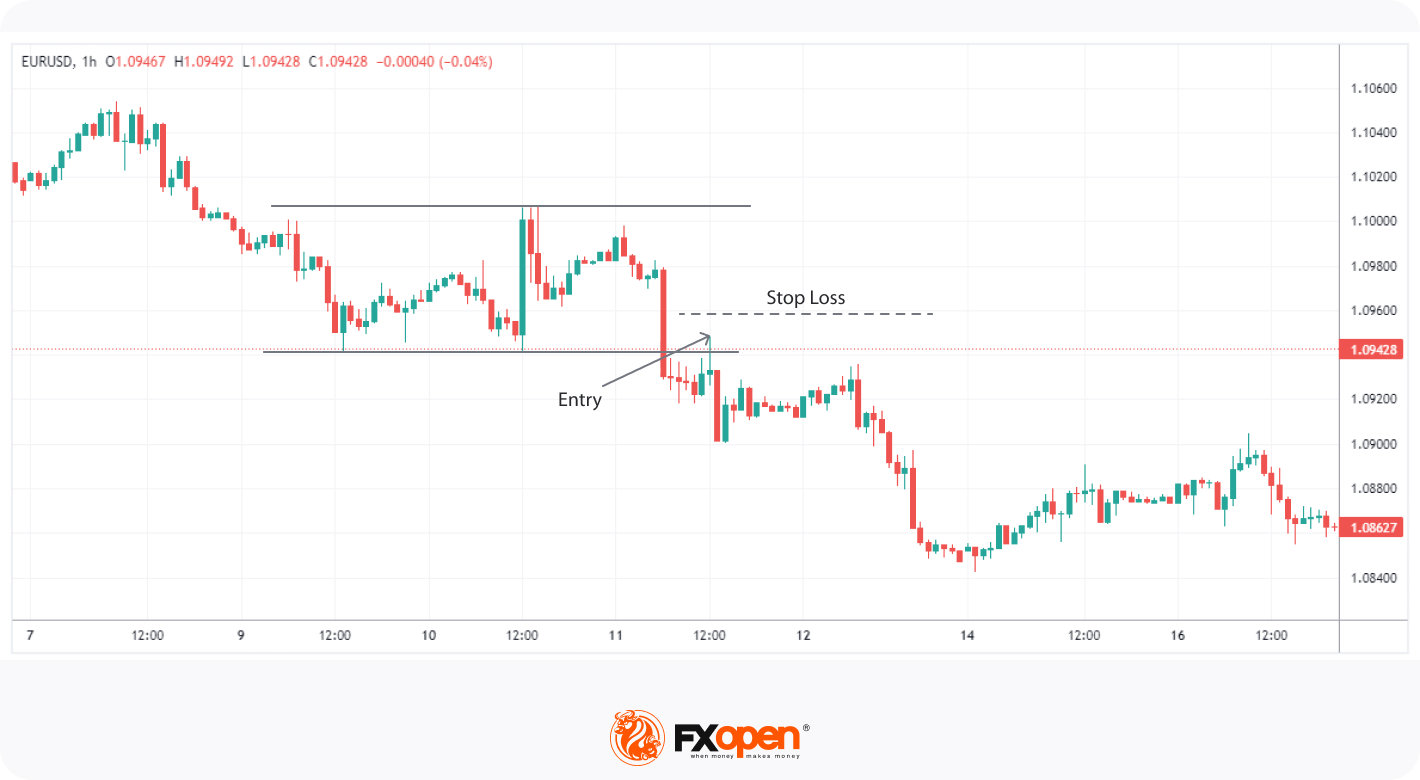
While the breakout strategy captures the initial price movement beyond a defined range, the breakout retest strategy involves waiting for the price to come back, or "retest", the breached level. This retest confirms the validity of the initial breakout and offers traders a secondary entry point. It capitalises on the principle that a previously established resistance may act as a new support in an uptrend and vice versa in a downtrend.
Entry/Exit Criteria
Entry
- Bullish Retest: After an upward breakout, traders look for a buying opportunity when the price retraces to the previously broken resistance, now acting as support.
- Bearish Retest: Post a downward breakout, a short position may be considered when the price revisits the old support, now transformed into resistance.
Stop Losses
- Bullish Retest: One could set a stop loss slightly below the new support level (previously resistance).
- Bearish Retest: Traders might consider placing a stop loss just above the new resistance level (former support).
Take Profits
- Profits might be taken based on upcoming resistance (for bullish retests) or support levels (for bearish retests), or when other technical indicators suggest a possible trend change.
A Pullback to 50%

The pullback to the 50% strategy is a nuanced approach that takes advantage of the natural ebb and flow of market movements. After a range is broken, instead of immediately capitalising on a retest, traders employing this strategy patiently await a deeper pullback, specifically to the midpoint between the range's high and low.
To find the 50% level, traders use the Fibonacci Retracement tool from the high to the low of the range they are targeting.
Entry/Exit Criteria
Entry
- Bullish Pullback: In an uptrend, traders can look for long entry opportunities when the price retraces to the 50% level between the range's low and high.
- Bearish Pullback: In a downtrend, shorting possibilities arise when the price moves up to the halfway point between the range's high and low.
Stop Losses
- Bullish Pullback: You can consider setting a stop loss just beyond the low of the original range.
- Bearish Pullback: Traders can place a stop loss slightly above the high of the initial range.
Take Profits
- Profits might be taken when the price approaches significant resistance (for bullish pullbacks) or support levels (for bearish pullbacks), or as informed by other technical factors.
A Pullback to a Moving Average

The pullback to moving average strategy marries the concept of a range breakout with the dynamic support or resistance levels provided by moving averages. While there are numerous moving averages traders might employ, the Exponential Moving Average (EMA) is a favourite among many due to its sensitivity to recent price movements.
Typically, for this strategy, longer-term periods like the 50-period or 200-period EMAs are preferred, offering a smoother and more reliable representation of the market's direction.
Entry/Exit Criteria
Entry
- Bullish Pullback: After an upward breakout, traders can seek long entry opportunities when the price touches or approaches a significant EMA, acting as a dynamic support.
- Bearish Pullback: Following a downward breakout, short entry opportunities become evident when the price meets or nears a vital EMA, serving as a dynamic resistance.
Stop Losses
- Bullish Pullback: A stop loss might be set just below the chosen EMA level.
- Bearish Pullback: You can consider positioning a stop loss slightly above the relevant EMA level.
Take Profits
- Profits might be taken as the price nears notable resistance (for bullish pullbacks) or support zones (for bearish pullbacks) or based on other technical signals.
Steps for Trading Range Breakouts and Pullbacks
When trading breakouts in forex, stocks, commodities, or crypto*, there are a few universal steps that may help:
- Volume Confirmation: When trading consolidation breakouts and pullbacks, a spike in trading volume can bolster the validity of a move. A high volume during a breakout indicates strong market participation, while a decreasing volume during a pullback suggests it's a temporary move.
- Multiple Indicators: Don't rely solely on one technique or indicator. Combining strategies, like using RSI or MACD alongside pullback methods, can provide a clearer trading signal.
- Chasing: If a breakout or pullback has already progressed significantly, it may be prudent to wait for another opportunity. Late entries can compromise potential returns and increase risk.
- False Breakouts: Not all breakouts sustain. Traders use stops and are always prepared to reassess if the breakout reverses quickly.
The Bottom Line
Harnessing the power of breakouts and pullbacks can elevate your trading, offering a strategic edge in ever-changing markets. These four strategies are a great place to start, regardless of your preferred market. To put these insights into action, you can consider opening an FXOpen account. Once you do, you’ll gain access to a broad range of markets, competitive trading costs, and lightning-fast execution speeds. Good luck!
*At FXOpen UK and FXOpen AU, Cryptocurrency CFDs are only available for trading by those clients categorised as Professional clients under FCA Rules and Professional clients under ASIC Rules, respectively. They are not available for trading by Retail clients.
This article represents the opinion of the Companies operating under the FXOpen brand only. It is not to be construed as an offer, solicitation, or recommendation with respect to products and services provided by the Companies operating under the FXOpen brand, nor is it to be considered financial advice.
Stay ahead of the market!
Subscribe now to our mailing list and receive the latest market news and insights delivered directly to your inbox.


Latest articles

Brent Crude Oil: From Ceasefire to Crossfire — What's Next?
Just weeks ago, traders were pricing in peace. Now they're pricing in war again—and that reversal says everything about how fragile the current Middle East calm really is.
Brent crude has surged to $86 a barrel, its highest level

AUD/USD and USD/CAD React to Softer US Inflation
Commodity-linked currencies strengthened after US inflation data came in weaker than expected. The Consumer Price Index (CPI) slowed to 3.5% year-on-year in June, below the 3.8% forecast, while core inflation eased to 2.6% versus expectations of 2.

NVIDIA: Kyber NVL144 Dispute Weighs on the Stock
NVIDIA shares found themselves at the centre of debate over the future of the Kyber NVL144 system. On 6 July, CNBC, citing research firm SemiAnalysis, reported that the project could be delayed by more than a year—from 2027 to